111 Timothy St Lagrange, GA 30240
Estimated Value: $40,000 - $121,000
About This Home
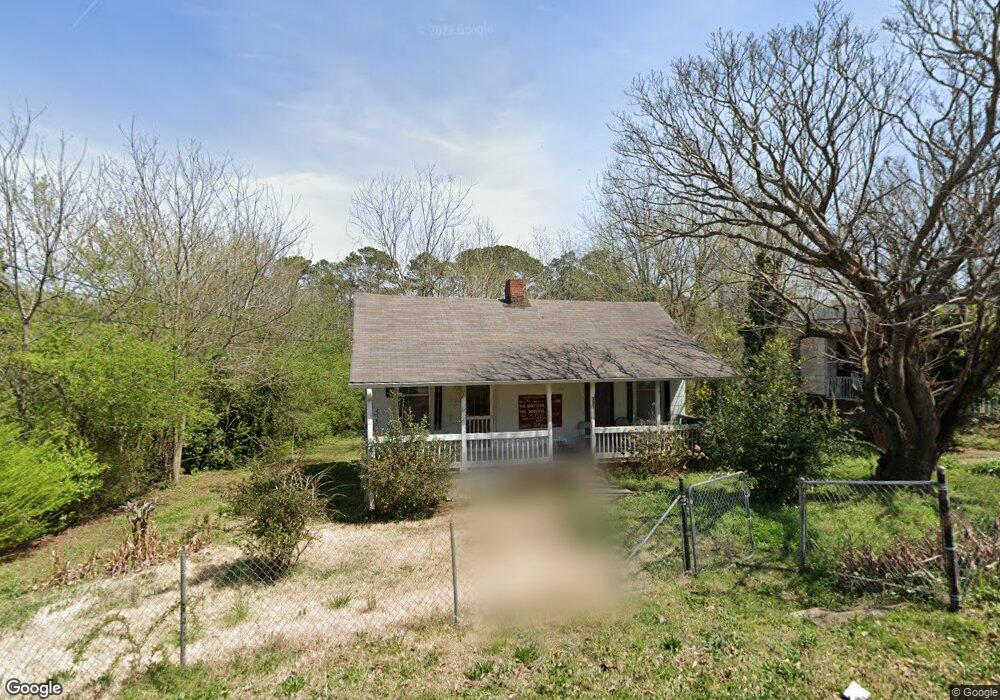
This home is located at 111 Timothy St, Lagrange, GA 30240 and is currently estimated at $76,395, approximately $115 per square foot. 111 Timothy St is a home located in Troup County with nearby schools including Ethel W. Kight Elementary School, Hollis Hand Elementary School, and Franklin Forest Elementary School.
Ownership History
We collect this data history from publicly available records. To have your information removed, we recommend requesting removal directly through your county’s website.
Purchase Details
Purchase Details
Purchase Details
Purchase Details
Purchase Details
Purchase Details
Purchase Details
Purchase Details
Purchase History
We collect this data history from publicly available records. To have your information removed, we recommend requesting removal directly through your county’s website.
| Date | Buyer | Sale Price | Title Company |
|---|---|---|---|
| $12,524 | -- | ||
| -- | -- | ||
| -- | -- | ||
| -- | -- | ||
| -- | -- | ||
| -- | -- | ||
| -- | -- | ||
| -- | -- |
Tax History
We collect this data history from publicly available records. To have your information removed, we recommend requesting removal directly through your county’s website.
| Year | Tax Paid | Tax Assessment Tax Assessment Total Assessment is a certain percentage of the fair market value that is determined by local assessors to be the total taxable value of land and additions on the property. | Land | Improvement |
|---|---|---|---|---|
| 2025 | $382 | $14,000 | $2,240 | $11,760 |
| 2024 | $331 | $12,120 | $2,240 | $9,880 |
| 2023 | $334 | $12,240 | $2,240 | $10,000 |
| 2022 | $323 | $11,560 | $2,240 | $9,320 |
| 2021 | $132 | $4,360 | $2,240 | $2,120 |
| 2020 | $132 | $4,360 | $2,240 | $2,120 |
| 2019 | $133 | $4,400 | $2,400 | $2,000 |
| 2018 | $133 | $4,400 | $2,400 | $2,000 |
| 2017 | $133 | $4,400 | $2,400 | $2,000 |
| 2016 | $151 | $5,017 | $2,400 | $2,617 |
| 2015 | $96 | $3,176 | $2,256 | $920 |
| 2014 | $96 | $3,176 | $2,256 | $920 |
| 2013 | -- | $3,176 | $2,256 | $920 |
Map
- 205 Grady St
- 903 Troup St
- 9 Crown St Unit LOT 4
- 3 Crown St Unit LOT 1
- 802 Monroe St
- 1015 Stonewall St
- 1017 Stonewall St
- 109 Garfield St
- 613 S Lee St
- 113 Oakview Ln
- 519 Freeman St
- 1402 Forrest Ave
- 138 Martha St
- 517 Jefferson St
- 905 South Pkwy
- 900 B N Pkwy
- 799 Hunnicutt St
- 797 Hunnicutt St
- 211 Moores Hill
- 0 Moores Hill
Ask me questions while you tour the home.