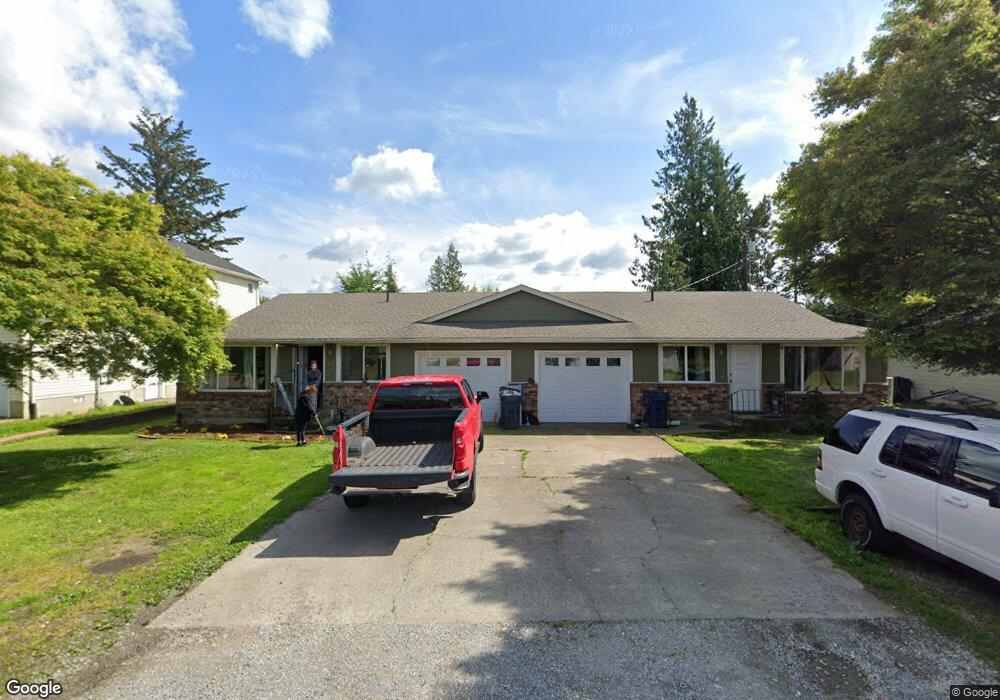
111 W 2nd St Everson, WA 98247
Estimated Value: $471,962 - $557,000
2
Beds
1
Bath
1,920
Sq Ft
$270/Sq Ft
Est. Value
About This Home
This home is located at 111 W 2nd St, Everson, WA 98247 and is currently estimated at $518,741, approximately $270 per square foot. 111 W 2nd St is a home located in Whatcom County with nearby schools including Everson Elementary School, Nooksack Elementary School, and Sumas Elementary School.
Ownership History
Date
Name
Owned For
Owner Type
Purchase Details
Closed on
May 29, 2007
Sold by
Anderson Mark and Anderson Ellie
Bought by
Groen Ronald W and Groen Cathy T
Current Estimated Value
Home Financials for this Owner
Home Financials are based on the most recent Mortgage that was taken out on this home.
Original Mortgage
$188,000
Interest Rate
6.12%
Mortgage Type
Purchase Money Mortgage
Purchase Details
Closed on
Nov 21, 2006
Sold by
Anderson Mark
Bought by
Anderson Mark and Anderson Ellie
Purchase Details
Closed on
Sep 11, 2002
Sold by
Gamlen John William and Maxine Jones E
Bought by
Shahan Clarence and Shahan Renae J
Home Financials for this Owner
Home Financials are based on the most recent Mortgage that was taken out on this home.
Original Mortgage
$156,000
Interest Rate
6.37%
Mortgage Type
Purchase Money Mortgage
Create a Home Valuation Report for This Property
The Home Valuation Report is an in-depth analysis detailing your home's value as well as a comparison with similar homes in the area
Home Values in the Area
Average Home Value in this Area
Purchase History
| Date | Buyer | Sale Price | Title Company |
|---|---|---|---|
| Groen Ronald W | $235,280 | Chicago Title Insurance | |
| Anderson Mark | -- | None Available | |
| Shahan Clarence | $165,000 | First American Title Insuran |
Source: Public Records
Mortgage History
| Date | Status | Borrower | Loan Amount |
|---|---|---|---|
| Closed | Groen Ronald W | $188,000 | |
| Previous Owner | Shahan Clarence | $156,000 |
Source: Public Records
Tax History
| Year | Tax Paid | Tax Assessment Tax Assessment Total Assessment is a certain percentage of the fair market value that is determined by local assessors to be the total taxable value of land and additions on the property. | Land | Improvement |
|---|---|---|---|---|
| 2025 | $3,852 | $431,429 | $188,100 | $243,329 |
| 2024 | $3,894 | $417,394 | $180,000 | $237,394 |
| 2023 | $3,894 | $433,697 | $154,962 | $278,735 |
| 2022 | $3,561 | $390,726 | $139,608 | $251,118 |
| 2021 | $3,290 | $322,918 | $115,380 | $207,538 |
| 2020 | $3,159 | $262,541 | $93,807 | $168,734 |
| 2019 | $2,675 | $262,541 | $93,807 | $168,734 |
| 2018 | $3,228 | $251,886 | $90,000 | $161,886 |
| 2017 | $2,887 | $226,723 | $63,800 | $162,923 |
| 2016 | $2,758 | $209,219 | $58,850 | $150,369 |
| 2015 | $2,336 | $200,713 | $56,760 | $143,953 |
| 2014 | -- | $194,489 | $55,000 | $139,489 |
| 2013 | -- | $194,489 | $55,000 | $139,489 |
Source: Public Records
Map
Nearby Homes
- 108 Baker St Unit 1-4
- 216 W 4th St
- 208 W 4th St
- 413 W 4th St
- 212 W 4th St
- 405 W 4th St
- 420 W 4th St
- 417 W 4th St
- 0 Walnut Grove Ct
- 110 Baker St Unit A & B
- 207 E Main St
- 408 W 3rd St
- 416 W 3rd St
- 107 River St
- 107 Thendara Park Dr Unit C
- 109 W 2nd St
- 405 Jackson Ct
- 304 W 3rd St
- 308 W 3rd St
- 310 W 3rd St
- 115 117 W 2nd St
- 0 W 2nd St Unit 913721
- 115 W 2nd St
- 102 W 2nd St Unit A&B
- 102 W 2nd St
- 112 W 1st St
- 210 N Harkness St
- 210 N Harkness St Unit 1, 2
- 108 W 1st St
- 112 W 2nd St Unit E
- 112 W 2nd St Unit D
- 112 W 2nd St Unit B
- 112 W 2nd St Unit A
- 112 W 2nd St
- 114 W 2nd St
- 116 W 1st St
- 122 W 2nd St
- 122 W 1st St
Your Personal Tour Guide
Ask me questions while you tour the home.