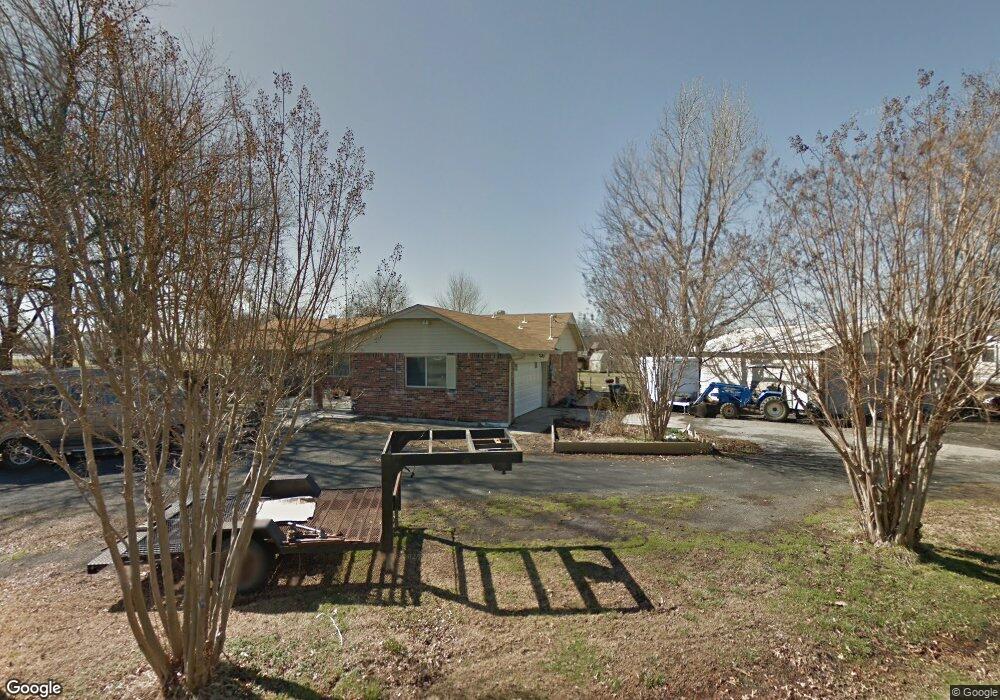
111 W 60th St S Muskogee, OK 74401
Estimated Value: $186,000 - $219,000
3
Beds
2
Baths
1,502
Sq Ft
$135/Sq Ft
Est. Value
About This Home
This home is located at 111 W 60th St S, Muskogee, OK 74401 and is currently estimated at $203,314, approximately $135 per square foot. 111 W 60th St S is a home located in Muskogee County with nearby schools including Hilldale Lower Elementary School, Hilldale Upper Elementary School, and Hilldale Middle School.
Ownership History
Date
Name
Owned For
Owner Type
Purchase Details
Closed on
Mar 23, 2021
Sold by
Jenks Family Rentals Llc
Bought by
Smith Louis E and Smith Judith A
Current Estimated Value
Home Financials for this Owner
Home Financials are based on the most recent Mortgage that was taken out on this home.
Original Mortgage
$100,000
Outstanding Balance
$74,166
Interest Rate
2.73%
Mortgage Type
New Conventional
Estimated Equity
$129,148
Purchase Details
Closed on
Oct 28, 2019
Sold by
Jenks Dennis Duane
Bought by
Jensk Family Rentals Llc
Purchase Details
Closed on
Dec 26, 2006
Sold by
Jenks Dennis Leo and Jenks Violet Marie
Bought by
Jenks Dennis Leo and Jenks Violet Marie
Home Financials for this Owner
Home Financials are based on the most recent Mortgage that was taken out on this home.
Original Mortgage
$67,000
Interest Rate
6.2%
Mortgage Type
New Conventional
Purchase Details
Closed on
Oct 10, 2003
Purchase Details
Closed on
Jul 18, 2003
Create a Home Valuation Report for This Property
The Home Valuation Report is an in-depth analysis detailing your home's value as well as a comparison with similar homes in the area
Home Values in the Area
Average Home Value in this Area
Purchase History
| Date | Buyer | Sale Price | Title Company |
|---|---|---|---|
| Smith Louis E | -- | Pioneer Abstract & Title Co | |
| Smith Louis E | -- | None Available | |
| Smith Louis E | $145,000 | Pioneer Abstract & Title Com | |
| Jensk Family Rentals Llc | -- | None Available | |
| Jenks Dennis Leo | -- | None Available | |
| -- | -- | -- | |
| -- | $85,000 | -- |
Source: Public Records
Mortgage History
| Date | Status | Borrower | Loan Amount |
|---|---|---|---|
| Open | Smith Louis E | $100,000 | |
| Closed | Smith Louis E | $100,000 | |
| Previous Owner | Jenks Dennis Leo | $67,000 |
Source: Public Records
Tax History Compared to Growth
Tax History
| Year | Tax Paid | Tax Assessment Tax Assessment Total Assessment is a certain percentage of the fair market value that is determined by local assessors to be the total taxable value of land and additions on the property. | Land | Improvement |
|---|---|---|---|---|
| 2024 | $1,654 | $15,936 | $1,504 | $14,432 |
| 2023 | $1,654 | $15,178 | $391 | $14,787 |
| 2022 | $1,585 | $15,178 | $391 | $14,787 |
| 2021 | $960 | $8,843 | $156 | $8,687 |
| 2020 | $1,117 | $10,354 | $1,533 | $8,821 |
| 2019 | $845 | $10,355 | $1,534 | $8,821 |
| 2018 | $845 | $10,355 | $1,534 | $8,821 |
| 2017 | $845 | $9,391 | $1,533 | $7,858 |
| 2016 | $845 | $9,391 | $1,533 | $7,858 |
| 2015 | $828 | $9,391 | $1,533 | $7,858 |
| 2014 | $0 | $9,391 | $1,533 | $7,858 |
Source: Public Records
Map
Nearby Homes
- 5801 S 8th St E
- 20 E Davis Field Rd
- 45 E Davis Field Rd
- 840 E 53rd St S
- 5632 S Julian Blvd
- 5666 S Julian Blvd
- 5876 S Julian Blvd
- 5467 S Julian Blvd
- 5495 S Julian Blvd
- 5523 S Julian Blvd
- 5496 S Julian Blvd
- 5524 S Julian Blvd
- 5556 S Julian Blvd
- 0 S Gulick St Unit 2518242
- 5400 Gulick St
- 1604 E Hudson Ave
- 1235 S 24th St W
- 1230 S 24th St W
- 1200 S 24th St W
- 1232 S 24th St W
- 110 W 60th St S
- 6021 S Cherokee St
- 5831 S Cherokee St
- 108 W 60th Place S
- 140 W 60th St S
- 116 W 60th Place S
- 120 W 60th Place S
- 5815 S Cherokee St
- 109 W 60th Place S
- 6041 S Cherokee St
- 124 W 60th Place S
- 124 W 60th Place S
- 128 W 60th Place S
- 111 W 58th St S
- 132 W 60th Place S
- 121 W 58th St S
- 6040 S Cherokee St
- 6051 S Cherokee St
- 130 W 61st St S
- 136 W 60th Place S