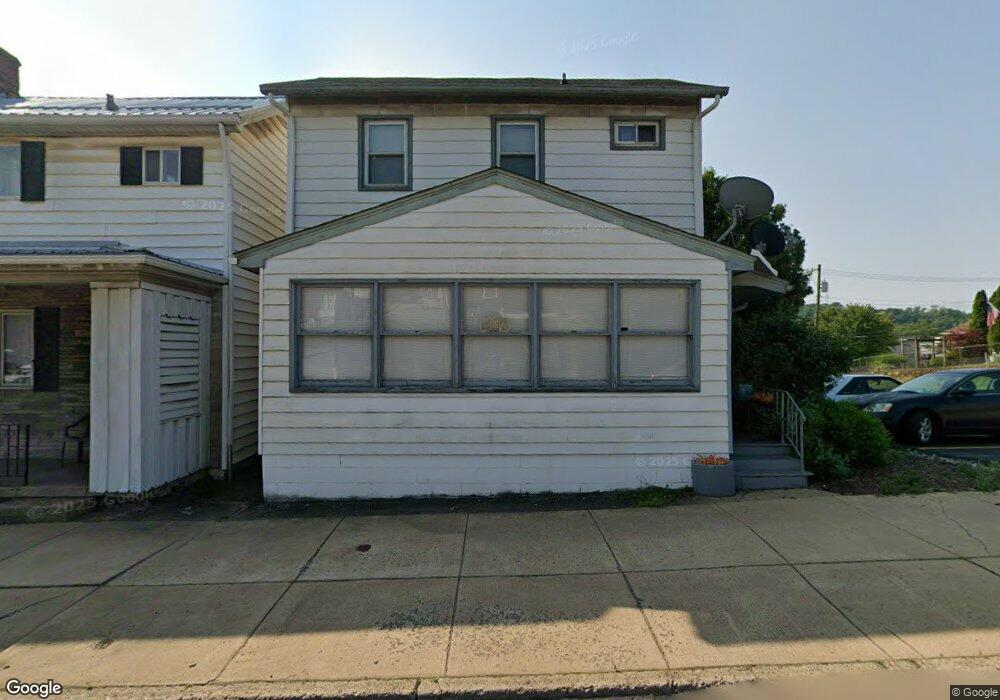
111 W 7th Ave Tarentum, PA 15084
Estimated Value: $48,000 - $89,000
2
Beds
2
Baths
1,528
Sq Ft
$48/Sq Ft
Est. Value
About This Home
This home is located at 111 W 7th Ave, Tarentum, PA 15084 and is currently estimated at $73,493, approximately $48 per square foot. 111 W 7th Ave is a home located in Allegheny County with nearby schools including Highlands Senior High School, Mary Queen of Apostles School, and St. Joseph High School.
Ownership History
Date
Name
Owned For
Owner Type
Purchase Details
Closed on
Aug 30, 2019
Sold by
Ruggeri John J and Ruggeri Jacqueline
Bought by
Wood Dylan
Current Estimated Value
Purchase Details
Closed on
Apr 25, 2006
Sold by
J & J Props Mgmt
Bought by
Ruggeri John J
Home Financials for this Owner
Home Financials are based on the most recent Mortgage that was taken out on this home.
Original Mortgage
$40,000
Interest Rate
6.4%
Mortgage Type
New Conventional
Purchase Details
Closed on
Sep 28, 2001
Sold by
Conroy C Loretta
Bought by
The Conroy Family Trust
Create a Home Valuation Report for This Property
The Home Valuation Report is an in-depth analysis detailing your home's value as well as a comparison with similar homes in the area
Home Values in the Area
Average Home Value in this Area
Purchase History
| Date | Buyer | Sale Price | Title Company |
|---|---|---|---|
| Wood Dylan | $33,000 | Attorney | |
| Ruggeri John J | $27,000 | -- | |
| The Conroy Family Trust | -- | -- |
Source: Public Records
Mortgage History
| Date | Status | Borrower | Loan Amount |
|---|---|---|---|
| Previous Owner | Ruggeri John J | $40,000 |
Source: Public Records
Tax History Compared to Growth
Tax History
| Year | Tax Paid | Tax Assessment Tax Assessment Total Assessment is a certain percentage of the fair market value that is determined by local assessors to be the total taxable value of land and additions on the property. | Land | Improvement |
|---|---|---|---|---|
| 2025 | $1,283 | $36,300 | $8,100 | $28,200 |
| 2024 | $1,283 | $36,300 | $8,100 | $28,200 |
| 2023 | $1,283 | $36,300 | $8,100 | $28,200 |
| 2022 | $1,274 | $36,300 | $8,100 | $28,200 |
| 2021 | $172 | $36,300 | $8,100 | $28,200 |
| 2020 | $1,274 | $36,300 | $8,100 | $28,200 |
| 2019 | $1,265 | $36,300 | $8,100 | $28,200 |
| 2018 | $172 | $36,300 | $8,100 | $28,200 |
| 2017 | $1,235 | $36,300 | $8,100 | $28,200 |
| 2016 | $172 | $36,300 | $8,100 | $28,200 |
| 2015 | $172 | $36,300 | $8,100 | $28,200 |
| 2014 | $1,235 | $36,300 | $8,100 | $28,200 |
Source: Public Records
Map
Nearby Homes