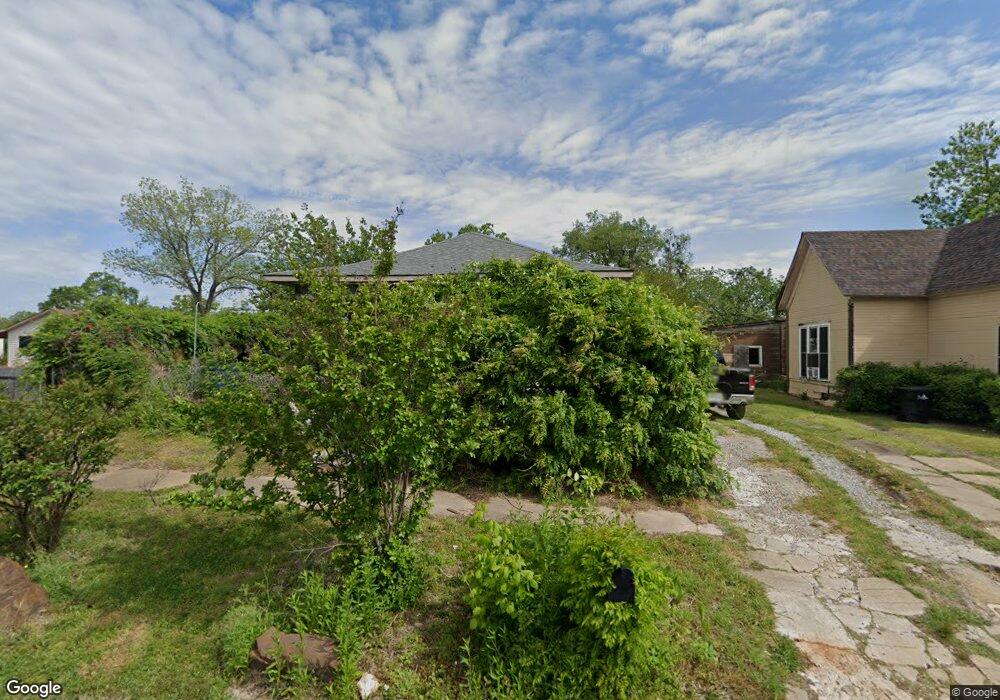
111 W Munson St Denison, TX 75021
Estimated Value: $131,000 - $132,606
2
Beds
1
Bath
1,212
Sq Ft
$109/Sq Ft
Est. Value
About This Home
This home is located at 111 W Munson St, Denison, TX 75021 and is currently estimated at $131,803, approximately $108 per square foot. 111 W Munson St is a home located in Grayson County with nearby schools including Lamar Elementary School, Scott Middle School, and Denison High School.
Ownership History
Date
Name
Owned For
Owner Type
Purchase Details
Closed on
Feb 13, 2017
Sold by
Bodholdt Aliene and Bodholdt Brent
Bought by
Molina Lionel
Current Estimated Value
Purchase Details
Closed on
May 25, 2004
Sold by
Dishman William E
Bought by
Bodholdt Brent and Bodholdt Aliene
Home Financials for this Owner
Home Financials are based on the most recent Mortgage that was taken out on this home.
Original Mortgage
$21,000
Interest Rate
5.93%
Mortgage Type
Purchase Money Mortgage
Create a Home Valuation Report for This Property
The Home Valuation Report is an in-depth analysis detailing your home's value as well as a comparison with similar homes in the area
Home Values in the Area
Average Home Value in this Area
Purchase History
| Date | Buyer | Sale Price | Title Company |
|---|---|---|---|
| Molina Lionel | $21,000 | None Available | |
| Bodholdt Brent | -- | -- |
Source: Public Records
Mortgage History
| Date | Status | Borrower | Loan Amount |
|---|---|---|---|
| Previous Owner | Bodholdt Brent | $21,000 |
Source: Public Records
Tax History
| Year | Tax Paid | Tax Assessment Tax Assessment Total Assessment is a certain percentage of the fair market value that is determined by local assessors to be the total taxable value of land and additions on the property. | Land | Improvement |
|---|---|---|---|---|
| 2025 | $741 | $76,319 | -- | -- |
| 2024 | $1,612 | $69,381 | $0 | $0 |
| 2023 | $630 | $63,074 | $0 | $0 |
| 2022 | $1,362 | $57,340 | $0 | $0 |
| 2021 | $1,315 | $64,678 | $20,625 | $44,053 |
| 2020 | $1,250 | $60,556 | $15,000 | $45,556 |
| 2019 | $1,185 | $56,003 | $9,000 | $47,003 |
| 2018 | $1,035 | $40,673 | $6,000 | $34,673 |
| 2017 | $949 | $33,904 | $3,450 | $30,454 |
| 2016 | $917 | $32,774 | $2,400 | $30,374 |
| 2015 | $0 | $26,808 | $2,400 | $24,408 |
| 2014 | -- | $26,808 | $2,400 | $24,408 |
Source: Public Records
Map
Nearby Homes
- 110 E Munson St
- 129 Texas E
- 326 W Day St
- 315 E Hull St
- 228 E Nelson St
- 312 E Day St
- 215 E Nelson St
- 512 S Lamar Ave
- 331 E Hull St
- 629 Munson St
- 633 Munson St
- 628 E Day St
- 330 W Texas St
- TBD S Travis Ave
- 108 E Nelson St
- 430 W Munson St
- 415 W Monterey St
- 101 E Murray St
- 511 W Munson St
- 1046 E Owings St
Your Personal Tour Guide
Ask me questions while you tour the home.