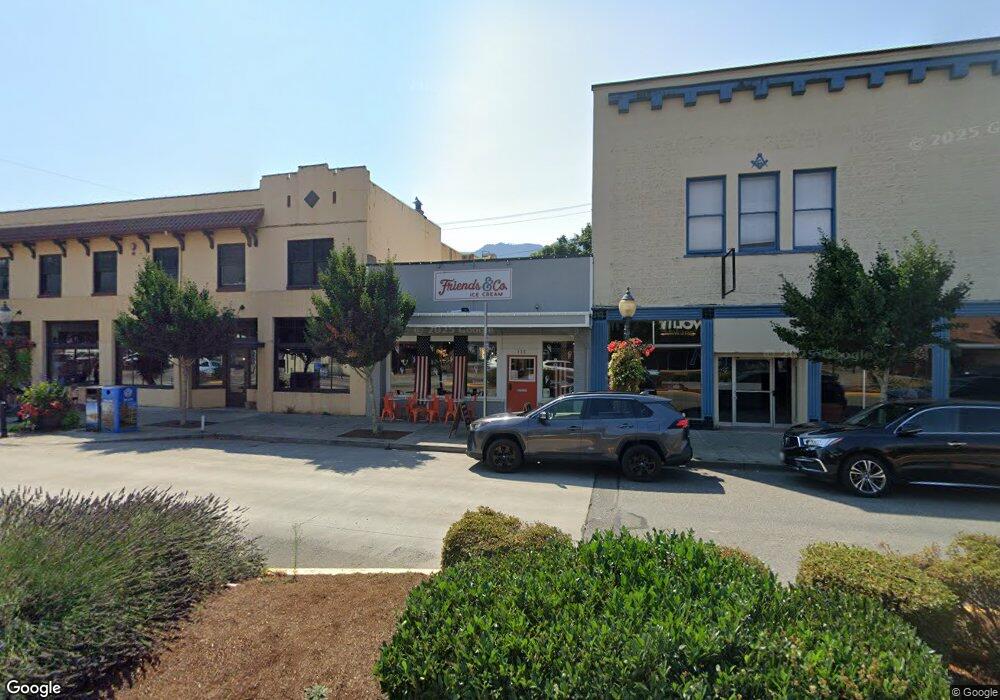
111 W North Bend Way North Bend, WA 98045
--
Bed
2
Baths
2,250
Sq Ft
2,483
Sq Ft Lot
About This Home
This home is located at 111 W North Bend Way, North Bend, WA 98045. 111 W North Bend Way is a home located in King County with nearby schools including North Bend Elementary School, Twin Falls Middle School, and Mount Si High School.
Ownership History
Date
Name
Owned For
Owner Type
Purchase Details
Closed on
Apr 15, 2013
Sold by
Patton Investment Llc
Bought by
Dizzy Bee Investing Llc
Home Financials for this Owner
Home Financials are based on the most recent Mortgage that was taken out on this home.
Original Mortgage
$420,400
Outstanding Balance
$297,282
Interest Rate
3.51%
Purchase Details
Closed on
Sep 17, 2007
Sold by
Hill & Perrell Llc
Bought by
Patton Investment Llc
Home Financials for this Owner
Home Financials are based on the most recent Mortgage that was taken out on this home.
Original Mortgage
$40,000
Interest Rate
6.61%
Purchase Details
Closed on
Apr 12, 2006
Sold by
Perrell Robert and Hathaway Perrell Pamela
Bought by
Hill & Perrell Llc
Purchase Details
Closed on
Nov 18, 2000
Sold by
Perrell Charles F
Bought by
Perrell Robert and Perrell Pamela
Purchase Details
Closed on
Feb 15, 2000
Sold by
Christensen Fred C and Christensen Evelyn
Bought by
Perrell Charles F and Charles F Perrell Trust
Create a Home Valuation Report for This Property
The Home Valuation Report is an in-depth analysis detailing your home's value as well as a comparison with similar homes in the area
Home Values in the Area
Average Home Value in this Area
Purchase History
| Date | Buyer | Sale Price | Title Company |
|---|---|---|---|
| Dizzy Bee Investing Llc | $445,000 | Stewart Title | |
| Patton Investment Llc | $577,000 | Chicago Title | |
| Hill & Perrell Llc | -- | The Talon Grou | |
| Perrell Robert | $125,900 | Washington Title | |
| Perrell Charles F | $250,000 | Washington Title |
Source: Public Records
Mortgage History
| Date | Status | Borrower | Loan Amount |
|---|---|---|---|
| Open | Dizzy Bee Investing Llc | $420,400 | |
| Previous Owner | Patton Investment Llc | $40,000 |
Source: Public Records
Tax History Compared to Growth
Tax History
| Year | Tax Paid | Tax Assessment Tax Assessment Total Assessment is a certain percentage of the fair market value that is determined by local assessors to be the total taxable value of land and additions on the property. | Land | Improvement |
|---|---|---|---|---|
| 2024 | $5,740 | $618,700 | $312,500 | $306,200 |
| 2023 | $3,628 | $562,500 | $200,000 | $362,500 |
| 2022 | $4,148 | $420,600 | $87,500 | $333,100 |
| 2021 | $4,704 | $382,500 | $52,500 | $330,000 |
| 2020 | $4,420 | $393,700 | $50,000 | $343,700 |
| 2018 | $6,250 | $328,300 | $40,000 | $288,300 |
| 2017 | $6,059 | $506,200 | $40,000 | $466,200 |
| 2016 | $7,044 | $506,200 | $40,000 | $466,200 |
| 2015 | $6,513 | $562,500 | $40,000 | $522,500 |
| 2014 | -- | $562,500 | $40,000 | $522,500 |
| 2013 | -- | $562,500 | $40,000 | $522,500 |
Source: Public Records
Map
Nearby Homes
- 313 Main Ave N
- 369 E Park St Unit D3
- 12918 412th Ave SE
- 690 SE 11th Place
- 690 SE 11th Place Unit 8
- 639 11th Place
- 821 NE 12th St Unit 31
- 1065 SW 12th St
- 751 SE 11th St
- 716 SE 11th Place
- 716 SE 11th Place Unit 7
- 639 SE 11th Place Unit 55
- Martin Plan at Harrison Court
- Savannah Plan at Harrison Court
- Caslon Plan at Harrison Court
- Legacy Plan at Harrison Court
- Bridgewater Plan at Harrison Court
- Stafford Plan at Harrison Court
- 668 SE 12th Place Unit 47
- 1117 Swiftwater Way SE
- 11 SE North Bend Way
- 3 W North Bend Way
- 125 W North Bend Way
- 125 N Bend Way
- 127 W North Bend Way
- 42010 N Bend Way Unit 29
- 129 W North Bend Way
- 129 W North Bend Way Unit B
- 78 E North Bend Way
- 11 E North Bend Way
- 79 E North Bend Way
- 101 E North Bend Way
- 240 Bendigo Blvd S
- 232 Bendigo Blvd S
- 248 Bendigo Blvd S
- 116 Main Ave N
- 202 W North Bend Way
- 202 W North Bend Way
- 113 Bendigo Blvd N Unit C
- 202 Taylor Ave S