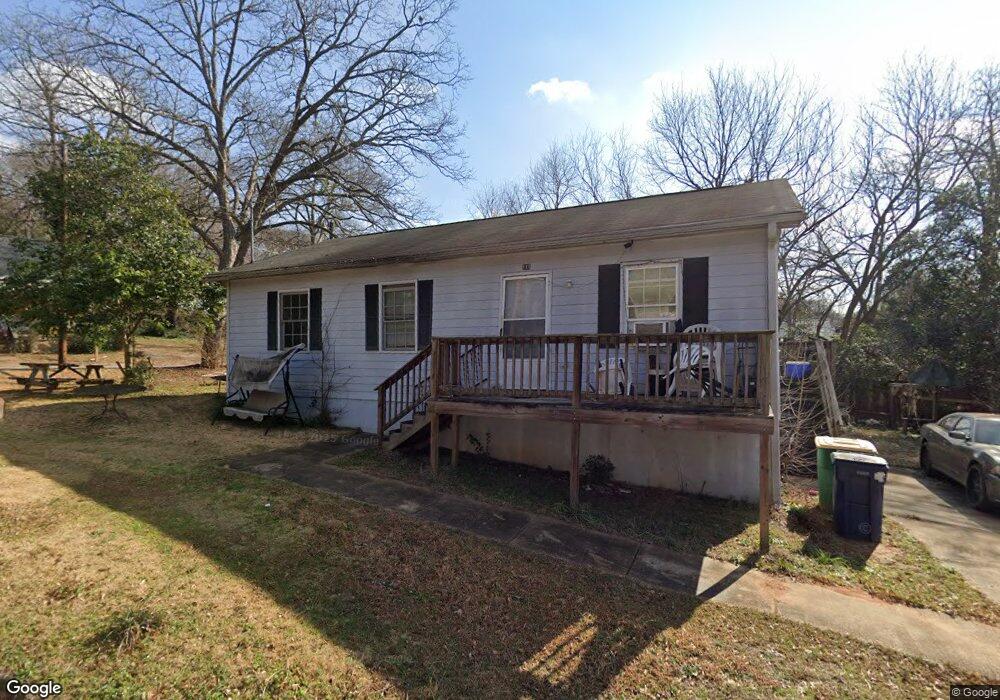
111 Warren St Athens, GA 30601
Chicopee-Dudley NeighborhoodEstimated Value: $183,232 - $230,000
--
Bed
--
Bath
1,000
Sq Ft
$210/Sq Ft
Est. Value
About This Home
This home is located at 111 Warren St, Athens, GA 30601 and is currently estimated at $209,558, approximately $209 per square foot. 111 Warren St is a home located in Clarke County with nearby schools including Gaines Elementary School, Hilsman Middle School, and Cedar Shoals High School.
Ownership History
Date
Name
Owned For
Owner Type
Purchase Details
Closed on
Oct 14, 2011
Sold by
Bugg Jennie Lou and Bugg John M
Bought by
Bugg Jennie L
Current Estimated Value
Home Financials for this Owner
Home Financials are based on the most recent Mortgage that was taken out on this home.
Original Mortgage
$135,000
Outstanding Balance
$131,508
Interest Rate
4.16%
Mortgage Type
Reverse Mortgage Home Equity Conversion Mortgage
Estimated Equity
$78,050
Purchase Details
Closed on
Oct 1, 1999
Sold by
Housing & Economic Leadership Partners
Bought by
Bugg Jennie Lou and Bugg Bugg
Purchase Details
Closed on
Oct 21, 1994
Sold by
Unified Government Of Athens-Clarke Co
Bought by
Housing & Economic Leadership Partners
Purchase Details
Closed on
Mar 14, 1994
Sold by
Willoughby Melvin O
Bought by
Unified Government Of Athens-Clarke Co
Purchase Details
Closed on
Jul 3, 1991
Sold by
Elder Cornelia Jones
Bought by
Willoughby Melvin O
Create a Home Valuation Report for This Property
The Home Valuation Report is an in-depth analysis detailing your home's value as well as a comparison with similar homes in the area
Home Values in the Area
Average Home Value in this Area
Purchase History
| Date | Buyer | Sale Price | Title Company |
|---|---|---|---|
| Bugg Jennie L | -- | -- | |
| Bugg Jennie Lou | $57,000 | -- | |
| Housing & Economic Leadership Partners | -- | -- | |
| Unified Government Of Athens-Clarke Co | $3,000 | -- | |
| Willoughby Melvin O | $9,900 | -- |
Source: Public Records
Mortgage History
| Date | Status | Borrower | Loan Amount |
|---|---|---|---|
| Open | Bugg Jennie L | $135,000 |
Source: Public Records
Tax History Compared to Growth
Tax History
| Year | Tax Paid | Tax Assessment Tax Assessment Total Assessment is a certain percentage of the fair market value that is determined by local assessors to be the total taxable value of land and additions on the property. | Land | Improvement |
|---|---|---|---|---|
| 2025 | $772 | $69,965 | $24,000 | $45,965 |
| 2024 | $772 | $65,588 | $24,000 | $41,588 |
| 2023 | $147 | $54,795 | $18,000 | $36,795 |
| 2022 | $728 | $44,664 | $16,000 | $28,664 |
| 2021 | $632 | $34,806 | $12,000 | $22,806 |
| 2020 | $576 | $30,702 | $10,400 | $20,302 |
| 2019 | $527 | $26,878 | $10,400 | $16,478 |
| 2018 | $503 | $25,165 | $10,400 | $14,765 |
| 2017 | $498 | $24,769 | $10,400 | $14,369 |
| 2016 | $479 | $24,110 | $10,400 | $13,710 |
| 2015 | $479 | $24,110 | $10,400 | $13,710 |
| 2014 | $479 | $24,110 | $10,400 | $13,710 |
Source: Public Records
Map
Nearby Homes