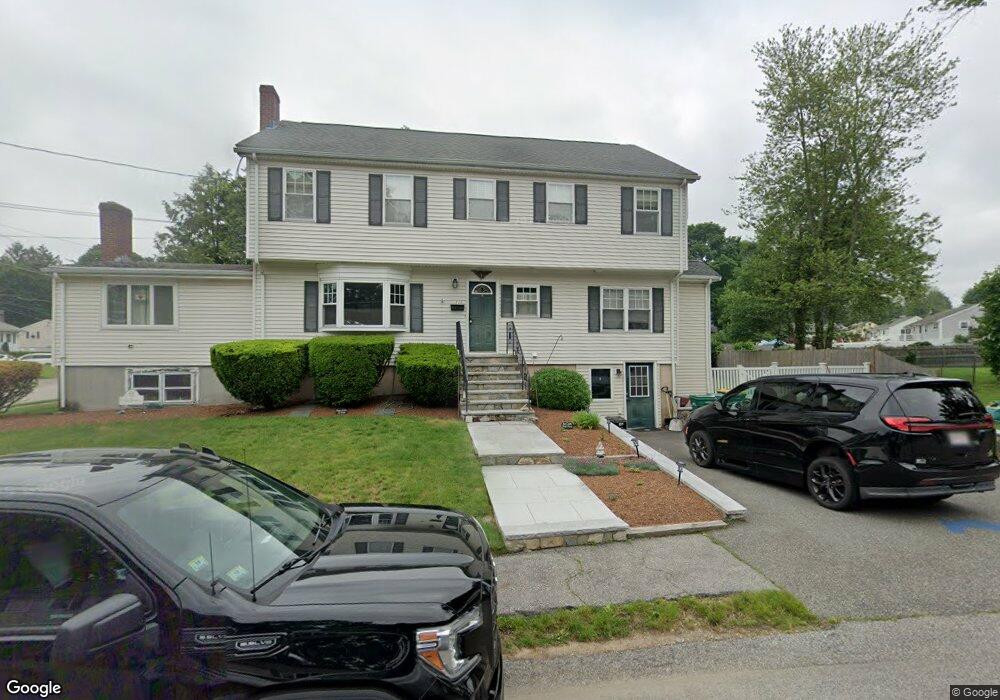
111 Westview Dr Norwood, MA 02062
Estimated Value: $870,404 - $1,099,000
5
Beds
4
Baths
2,476
Sq Ft
$385/Sq Ft
Est. Value
About This Home
This home is located at 111 Westview Dr, Norwood, MA 02062 and is currently estimated at $954,101, approximately $385 per square foot. 111 Westview Dr is a home located in Norfolk County with nearby schools including Norwood High School, St Catherine Of Siena School, and Norwood Montessori School.
Ownership History
Date
Name
Owned For
Owner Type
Purchase Details
Closed on
Aug 19, 1998
Sold by
Collins James F and Collins Virginia D
Bought by
Brown Michael R and Brown Susan E
Current Estimated Value
Home Financials for this Owner
Home Financials are based on the most recent Mortgage that was taken out on this home.
Original Mortgage
$171,000
Outstanding Balance
$35,488
Interest Rate
6.86%
Mortgage Type
Purchase Money Mortgage
Estimated Equity
$918,613
Create a Home Valuation Report for This Property
The Home Valuation Report is an in-depth analysis detailing your home's value as well as a comparison with similar homes in the area
Home Values in the Area
Average Home Value in this Area
Purchase History
| Date | Buyer | Sale Price | Title Company |
|---|---|---|---|
| Brown Michael R | $190,000 | -- |
Source: Public Records
Mortgage History
| Date | Status | Borrower | Loan Amount |
|---|---|---|---|
| Open | Brown Michael R | $171,000 |
Source: Public Records
Tax History Compared to Growth
Tax History
| Year | Tax Paid | Tax Assessment Tax Assessment Total Assessment is a certain percentage of the fair market value that is determined by local assessors to be the total taxable value of land and additions on the property. | Land | Improvement |
|---|---|---|---|---|
| 2025 | $84 | $803,100 | $299,400 | $503,700 |
| 2024 | $8,113 | $774,900 | $299,400 | $475,500 |
| 2023 | $7,340 | $711,200 | $250,900 | $460,300 |
| 2022 | $6,749 | $627,800 | $219,500 | $408,300 |
| 2021 | $6,657 | $587,000 | $221,900 | $365,100 |
| 2020 | $6,572 | $589,400 | $213,600 | $375,800 |
| 2019 | $5,839 | $536,200 | $207,400 | $328,800 |
| 2018 | $5,648 | $509,300 | $197,600 | $311,700 |
| 2017 | $5,608 | $503,000 | $197,600 | $305,400 |
| 2016 | $5,266 | $473,600 | $197,600 | $276,000 |
| 2015 | $5,262 | $458,800 | $179,600 | $279,200 |
| 2014 | $5,086 | $439,200 | $179,200 | $260,000 |
Source: Public Records
Map
Nearby Homes
- 53-55 Whitewood Cir
- 136 Azalea Dr
- 105 E Cross St
- 124 Juniper Dr
- 188 Richland Rd
- 794 Neponset St
- 558 Pleasant St
- 22 Hillside Ave
- 0 Deerfield Rd
- 28 Shaw St
- 816 Neponset St
- 0 Quail Run
- 19-21
- 909 Washington St Unit 14
- 909 Washington St
- 15-17 Heaton Ave
- 1086 Washington St
- 49 Railroad Ave
- 25-29 Chapel St
- 785 Washington St Unit 206