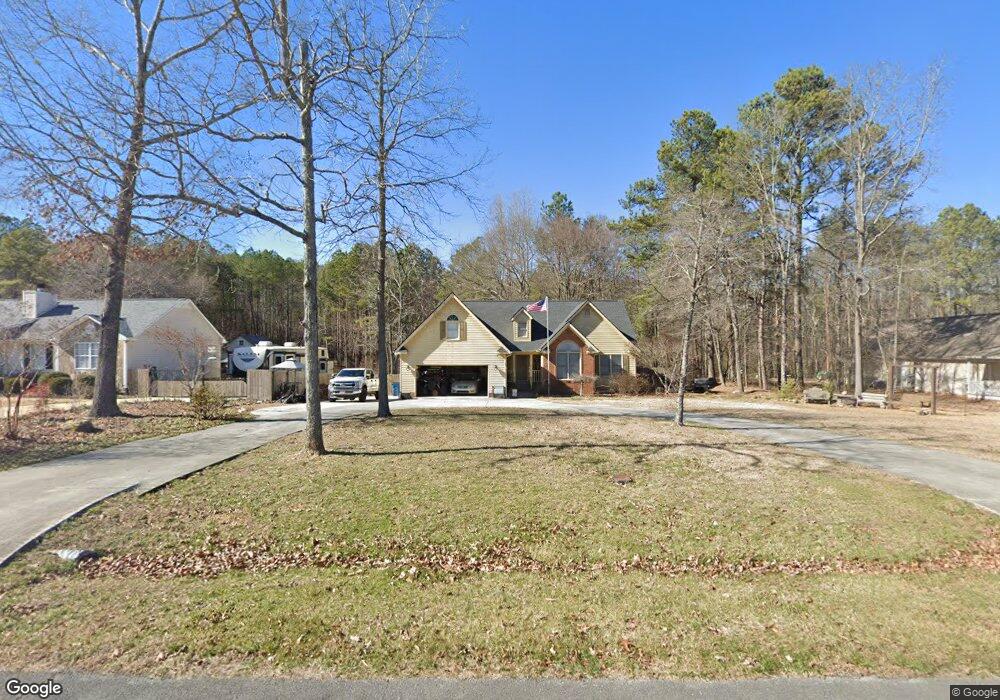
111 Windmill Dr SE Silver Creek, GA 30173
Estimated Value: $267,512 - $331,000
3
Beds
2
Baths
1,546
Sq Ft
$196/Sq Ft
Est. Value
About This Home
This home is located at 111 Windmill Dr SE, Silver Creek, GA 30173 and is currently estimated at $302,628, approximately $195 per square foot. 111 Windmill Dr SE is a home located in Floyd County with nearby schools including Pepperell Middle School and Pepperell High School.
Ownership History
Date
Name
Owned For
Owner Type
Purchase Details
Closed on
May 28, 2009
Sold by
Martin Ian Pierre
Bought by
Swanson Kevin M and Swanson Brandy M
Current Estimated Value
Home Financials for this Owner
Home Financials are based on the most recent Mortgage that was taken out on this home.
Original Mortgage
$148,265
Outstanding Balance
$92,055
Interest Rate
4.77%
Mortgage Type
FHA
Estimated Equity
$210,573
Purchase Details
Closed on
Oct 20, 2005
Sold by
Martin Catherine N
Bought by
Martin Ian Pierre
Purchase Details
Closed on
Mar 26, 2002
Sold by
Carter Jenny M
Bought by
Martin Catherine N and Ian Pierre Mar
Purchase Details
Closed on
Feb 19, 1999
Sold by
Lewis Freddie
Bought by
Carter Jenny M
Purchase Details
Closed on
Aug 5, 1998
Sold by
Stephens Stanley
Bought by
Lewis Freddie
Purchase Details
Closed on
Mar 27, 1995
Bought by
Stephens Stanley
Create a Home Valuation Report for This Property
The Home Valuation Report is an in-depth analysis detailing your home's value as well as a comparison with similar homes in the area
Purchase History
| Date | Buyer | Sale Price | Title Company |
|---|---|---|---|
| Swanson Kevin M | $151,000 | -- | |
| Martin Ian Pierre | -- | -- | |
| Martin Catherine N | $128,000 | -- | |
| Carter Jenny M | $97,500 | -- | |
| Lewis Freddie | $285,000 | -- | |
| Stephens Stanley | -- | -- |
Source: Public Records
Mortgage History
| Date | Status | Borrower | Loan Amount |
|---|---|---|---|
| Open | Swanson Kevin M | $148,265 |
Source: Public Records
Tax History
| Year | Tax Paid | Tax Assessment Tax Assessment Total Assessment is a certain percentage of the fair market value that is determined by local assessors to be the total taxable value of land and additions on the property. | Land | Improvement |
|---|---|---|---|---|
| 2025 | $2,929 | $99,622 | $11,130 | $88,492 |
| 2024 | $2,929 | $93,565 | $10,500 | $83,065 |
| 2023 | $2,753 | $79,356 | $10,500 | $68,856 |
| 2022 | $2,103 | $68,305 | $10,000 | $58,305 |
| 2021 | $1,982 | $63,202 | $10,000 | $53,202 |
| 2020 | $1,925 | $60,931 | $10,000 | $50,931 |
| 2019 | $1,738 | $55,664 | $10,000 | $45,664 |
| 2018 | $1,670 | $53,394 | $10,000 | $43,394 |
| 2017 | $1,590 | $50,625 | $10,000 | $40,625 |
| 2016 | $1,590 | $50,000 | $10,000 | $40,000 |
| 2015 | -- | $50,480 | $10,000 | $40,480 |
| 2014 | -- | $50,519 | $10,000 | $40,519 |
Source: Public Records
Map
Nearby Homes
- 106 Windmill Dr SE
- 6792 Rockmart Rd SE
- 0 Hwy 101 and Dean Rd Unit 10620814
- 526 Brice Station Rd
- 1062 Bethel Church Rd SE
- 463 Compton Rd SE
- 0 Collard Valley Rd Unit 10726935
- 0 Collard Valley Rd Unit 7748592
- 5712 Rockmart Rd SE
- 1005 Harmony Rd SE
- 850 Bethel Church Rd SE
- 110 Williams Rd SE
- 406 & 410 Old Rome Rd
- 1776 Wax Rd SE
- 452 Terry White Rd
- 2A Relay Rd
- 277 Bethel Church Rd SE
- 573 Relay Rd SE
- 340 Terry White Rd
- 998 Dunn Rd
- 125 Windmill Dr SE
- 99 Windmill Dr SE
- 87 Windmill Dr SE
- 135 Windmill Dr SE
- 8 Pond Mill Ct SE
- 92 Windmill Dr SE
- 75 Windmill Dr SE
- 76 Windmill Dr SE
- 22 Pond Mill Ct SE
- 142 Windmill Dr SE
- 65 Windmill Dr SE
- 62 Windmill Dr SE
- 23 Pond Mill Ct SE
- 34 Pond Mill Ct SE
- 55 Windmill Dr SE
- 35 Pond Mill Ct SE
- 156 Windmill Dr SE
- 46 Windmill Dr SE
- 42 Pond Mill Ct SE
- 41 Windmill Dr SE
Your Personal Tour Guide
Ask me questions while you tour the home.