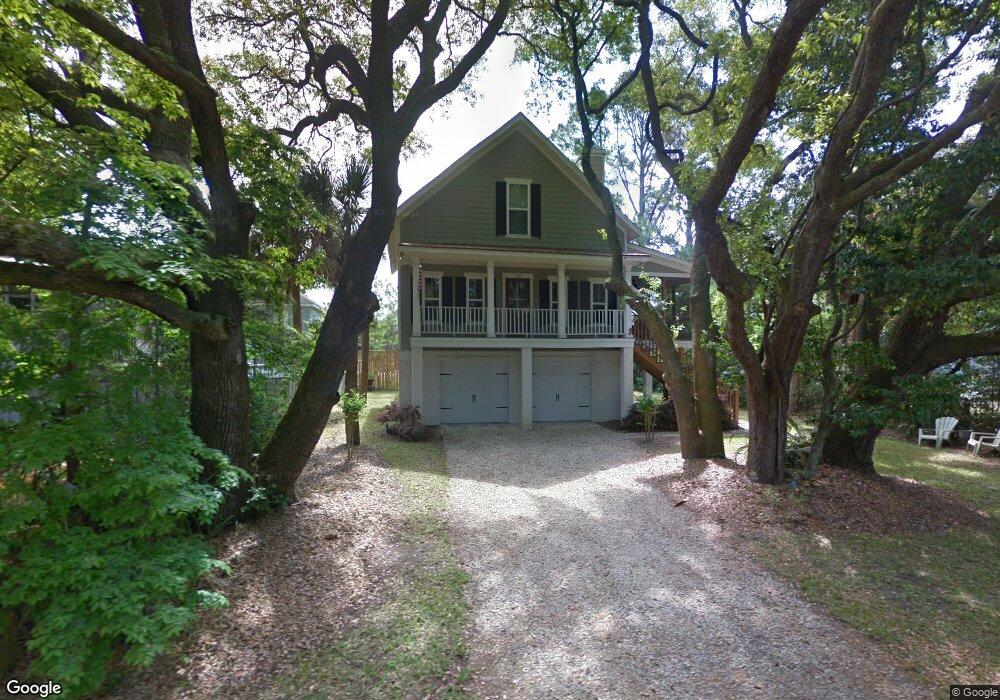
1110 2nd Ave Tybee Island, GA 31328
Estimated Value: $732,869 - $862,000
3
Beds
3
Baths
1,648
Sq Ft
$483/Sq Ft
Est. Value
About This Home
This home is located at 1110 2nd Ave, Tybee Island, GA 31328 and is currently estimated at $795,717, approximately $482 per square foot. 1110 2nd Ave is a home with nearby schools including Howard Elementary School, Coastal Middle School, and Islands High School.
Ownership History
Date
Name
Owned For
Owner Type
Purchase Details
Closed on
Aug 9, 2022
Sold by
Gannon Robert W
Bought by
Gannon Robert W and Gannon Robert Sean
Current Estimated Value
Purchase Details
Closed on
Mar 14, 2007
Sold by
Not Provided
Bought by
Gannon Robert
Create a Home Valuation Report for This Property
The Home Valuation Report is an in-depth analysis detailing your home's value as well as a comparison with similar homes in the area
Home Values in the Area
Average Home Value in this Area
Purchase History
| Date | Buyer | Sale Price | Title Company |
|---|---|---|---|
| Gannon Robert W | -- | -- | |
| Gannon Robert | -- | -- |
Source: Public Records
Tax History Compared to Growth
Tax History
| Year | Tax Paid | Tax Assessment Tax Assessment Total Assessment is a certain percentage of the fair market value that is determined by local assessors to be the total taxable value of land and additions on the property. | Land | Improvement |
|---|---|---|---|---|
| 2025 | $6,148 | $300,000 | $120,000 | $180,000 |
| 2024 | $6,148 | $300,000 | $120,000 | $180,000 |
| 2023 | $4,109 | $313,080 | $120,000 | $193,080 |
| 2022 | $5,902 | $294,720 | $120,000 | $174,720 |
| 2021 | $5,856 | $263,000 | $54,000 | $209,000 |
| 2020 | $5,995 | $276,880 | $54,000 | $222,880 |
| 2019 | $5,898 | $276,880 | $54,000 | $222,880 |
| 2018 | $4,205 | $218,720 | $54,000 | $164,720 |
| 2017 | $4,464 | $174,840 | $64,480 | $110,360 |
| 2016 | $3,945 | $158,720 | $64,480 | $94,240 |
| 2015 | $3,982 | $159,880 | $64,480 | $95,400 |
| 2014 | $5,871 | $160,600 | $0 | $0 |
Source: Public Records
Map
Nearby Homes
- 1108 2nd Ave
- 1111 Lovell Ave
- 1107 Lovell Ave
- 1106 2nd Ave
- 1114 2nd Ave
- 1109 2nd Ave
- 1105 Lovell Ave
- 1113 Lovell Ave Unit Studio #3
- 1113 Lovell Ave
- 1111 2nd Ave
- 1105 2nd Ave
- 1103 Lovell Ave
- 202 12th St
- 1103 2nd Ave
- 1108 Jones Ave
- 1113 2nd Ave
- 1106 Lovell Ave
- 203 11th St
- 1114 Jones Ave
- 1101 Lovell Ave