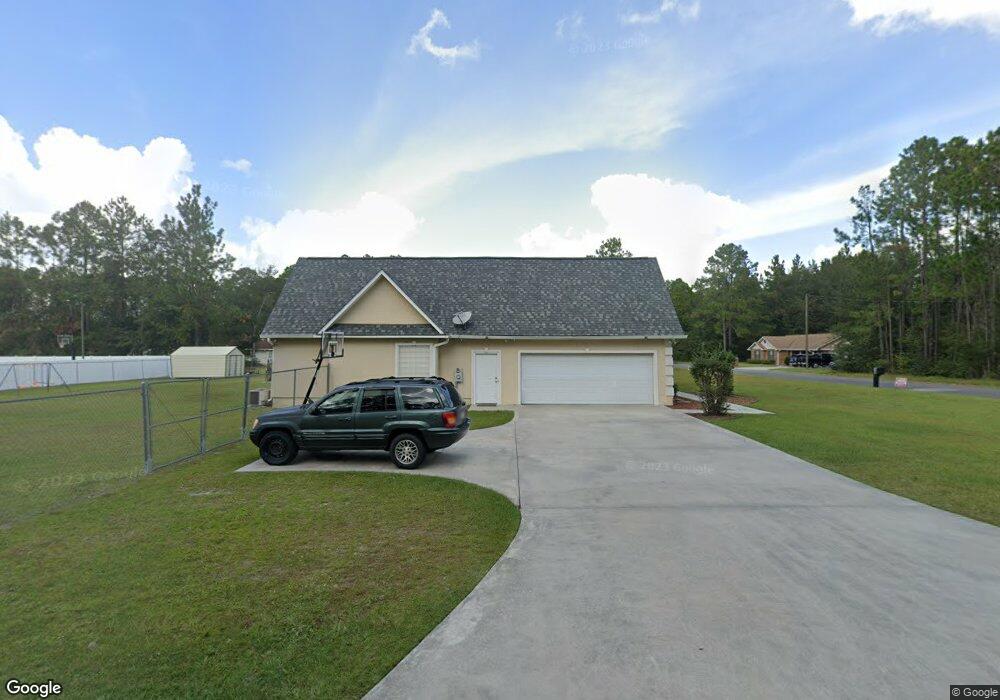
1110 Assembly St Waycross, GA 31501
Estimated Value: $156,000 - $260,000
3
Beds
3
Baths
2,092
Sq Ft
$105/Sq Ft
Est. Value
About This Home
This home is located at 1110 Assembly St, Waycross, GA 31501 and is currently estimated at $220,702, approximately $105 per square foot. 1110 Assembly St is a home located in Ware County with nearby schools including Memorial Drive Elementary School, Waycross Middle School, and Ware County High School.
Ownership History
Date
Name
Owned For
Owner Type
Purchase Details
Closed on
Apr 15, 2022
Sold by
Threat John A
Bought by
Gibson Damon N
Current Estimated Value
Home Financials for this Owner
Home Financials are based on the most recent Mortgage that was taken out on this home.
Original Mortgage
$207,374
Outstanding Balance
$193,756
Interest Rate
3.76%
Mortgage Type
FHA
Estimated Equity
$26,946
Purchase Details
Closed on
Jun 4, 2018
Sold by
Threat Brandi C
Bought by
Threat John A
Home Financials for this Owner
Home Financials are based on the most recent Mortgage that was taken out on this home.
Original Mortgage
$135,000
Interest Rate
4.5%
Mortgage Type
VA
Purchase Details
Closed on
Mar 30, 1999
Sold by
Chappel Janice and Chappel Eta
Bought by
Threat John A and Threat Bran
Purchase Details
Closed on
Aug 23, 1993
Bought by
Chappel Janice and Chappel Eta
Create a Home Valuation Report for This Property
The Home Valuation Report is an in-depth analysis detailing your home's value as well as a comparison with similar homes in the area
Home Values in the Area
Average Home Value in this Area
Purchase History
| Date | Buyer | Sale Price | Title Company |
|---|---|---|---|
| Gibson Damon N | $211,200 | -- | |
| Threat John A | -- | -- | |
| Threat John A | $6,500 | -- | |
| Chappel Janice | $4,800 | -- |
Source: Public Records
Mortgage History
| Date | Status | Borrower | Loan Amount |
|---|---|---|---|
| Open | Gibson Damon N | $207,374 | |
| Previous Owner | Threat John A | $135,000 |
Source: Public Records
Tax History Compared to Growth
Tax History
| Year | Tax Paid | Tax Assessment Tax Assessment Total Assessment is a certain percentage of the fair market value that is determined by local assessors to be the total taxable value of land and additions on the property. | Land | Improvement |
|---|---|---|---|---|
| 2024 | $1,783 | $73,352 | $3,360 | $69,992 |
| 2023 | $1,820 | $53,861 | $2,240 | $51,621 |
| 2022 | $2,117 | $53,131 | $2,240 | $50,891 |
| 2021 | $2,138 | $49,478 | $2,240 | $47,238 |
| 2020 | $2,067 | $47,424 | $2,240 | $45,184 |
| 2019 | $2,006 | $45,370 | $2,240 | $43,130 |
| 2018 | $0 | $43,316 | $2,240 | $41,076 |
| 2017 | $1,900 | $43,316 | $2,240 | $41,076 |
| 2016 | $1,900 | $43,316 | $2,240 | $41,076 |
| 2015 | -- | $43,316 | $2,240 | $41,076 |
| 2014 | -- | $43,321 | $2,240 | $41,081 |
| 2013 | -- | $51,146 | $2,240 | $48,906 |
Source: Public Records
Map
Nearby Homes
- 1106 Senate St
- 1111 Congress St
- 1104 Senate St
- 1105 Assembly St
- 1102 Senate St
- 1210 Congress St
- 1302 Congress St
- 1203 Assembly St
- 1101 Senate St
- 1020 Assembly St
- 1104 Lord St
- 1109 Congress St
- 1312 Congress St
- 1110 Congress St
- 0 Senate St
- 805 Senate St
- 1104 Congress St
- 000 Senate St
- 1401 Congress St
- 1003 Senate St