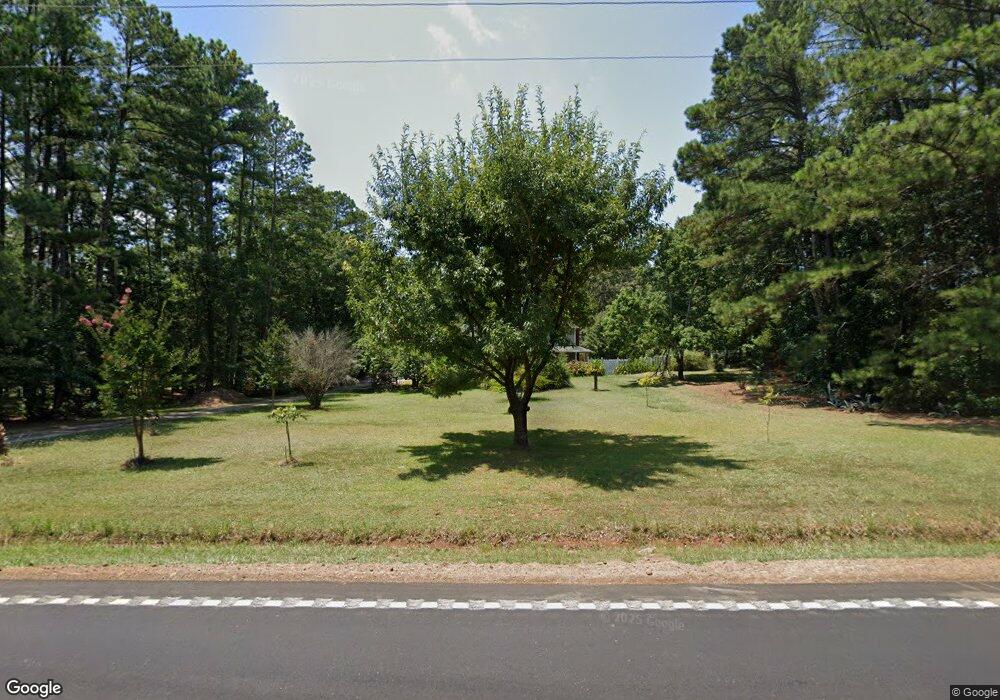
1110 Callison Hwy Greenwood, SC 29646
Estimated Value: $200,000 - $317,000
3
Beds
3
Baths
1,800
Sq Ft
$145/Sq Ft
Est. Value
About This Home
This home is located at 1110 Callison Hwy, Greenwood, SC 29646 and is currently estimated at $261,076, approximately $145 per square foot. 1110 Callison Hwy is a home located in Greenwood County with nearby schools including Mathews Elementary School, Westview Middle School, and Emerald High School.
Ownership History
Date
Name
Owned For
Owner Type
Purchase Details
Closed on
Apr 23, 2024
Sold by
Taylor Cindy Reardick and Taylor Cynthia R
Bought by
Rearick Roger L
Current Estimated Value
Home Financials for this Owner
Home Financials are based on the most recent Mortgage that was taken out on this home.
Original Mortgage
$96,000
Outstanding Balance
$87,913
Interest Rate
6.16%
Mortgage Type
Seller Take Back
Estimated Equity
$173,163
Purchase Details
Closed on
May 31, 2022
Sold by
Rearick Roger L
Bought by
Taylor Cindy Rearick
Home Financials for this Owner
Home Financials are based on the most recent Mortgage that was taken out on this home.
Original Mortgage
$70,000
Interest Rate
5.27%
Mortgage Type
New Conventional
Purchase Details
Closed on
Sep 24, 2010
Sold by
Rearick Roger L
Bought by
Rearick Carol J
Create a Home Valuation Report for This Property
The Home Valuation Report is an in-depth analysis detailing your home's value as well as a comparison with similar homes in the area
Home Values in the Area
Average Home Value in this Area
Purchase History
| Date | Buyer | Sale Price | Title Company |
|---|---|---|---|
| Rearick Roger L | $96,000 | None Listed On Document | |
| Rearick Roger L | $96,000 | None Listed On Document | |
| Taylor Cindy Rearick | $140,000 | None Listed On Document | |
| Rearick Carol J | -- | -- | |
| Rearick Roger L | $146,000 | -- |
Source: Public Records
Mortgage History
| Date | Status | Borrower | Loan Amount |
|---|---|---|---|
| Open | Rearick Roger L | $96,000 | |
| Closed | Rearick Roger L | $96,000 | |
| Previous Owner | Taylor Cindy Rearick | $70,000 |
Source: Public Records
Tax History Compared to Growth
Tax History
| Year | Tax Paid | Tax Assessment Tax Assessment Total Assessment is a certain percentage of the fair market value that is determined by local assessors to be the total taxable value of land and additions on the property. | Land | Improvement |
|---|---|---|---|---|
| 2024 | $1,065 | $6,320 | $0 | $0 |
| 2023 | $1,065 | $6,320 | $0 | $0 |
| 2022 | $1,054 | $6,320 | $0 | $0 |
| 2021 | $1,041 | $6,320 | $0 | $0 |
| 2020 | $1,037 | $6,120 | $0 | $0 |
| 2019 | $1,033 | $6,120 | $0 | $0 |
| 2018 | $1,022 | $153,000 | $18,000 | $135,000 |
| 2017 | $1,013 | $153,000 | $18,000 | $135,000 |
| 2016 | $1,010 | $153,000 | $18,000 | $135,000 |
| 2015 | $1,031 | $156,700 | $18,000 | $138,700 |
| 2014 | $1,016 | $6,270 | $0 | $0 |
| 2010 | -- | $140,300 | $11,700 | $128,600 |
Source: Public Records
Map
Nearby Homes
- 107/109 Callison Dr
- 300 Callison Hwy
- 3920 Harless St
- 309 Tedards Store Rd
- 0 Callison Hwy
- 1609 Rock House Rd
- 119 Meadowview Ln
- 19 acres S Highway 25
- 104 Mabrey Ct
- 108 Cottonwood St
- 2513 U S 25
- 548 Davis St
- 106 Foxcroft
- 411 Abbott Ave
- 409 Abbott Ave
- 118 Princess Ct
- 403 Abbott Ave
- 105 Morgan Ave
- 101 Kentucky Ct
- 113 Church Ave
- 1114 Callison Hwy
- 104 S Callison Dr
- 104 Callison Dr
- 103 Callison Dr
- 111 Callison Dr
- 105 Welborn Ln
- 104 Welborn Ln
- 109 Welborn Ln
- 5202 Callison Hwy
- 164 Callison Dr
- 162 Callison Dr
- 172 Callison Dr
- 160 Callison Dr
- 619 Callison Hwy
- 651 Callison Hwy
- - Callison Hwy
- ---- Chipley Rd
- 0 Chipley Rd
- 551 Chipley Rd