Estimated Value: $388,000 - $409,000
3
Beds
2
Baths
1,024
Sq Ft
$389/Sq Ft
Est. Value
About This Home
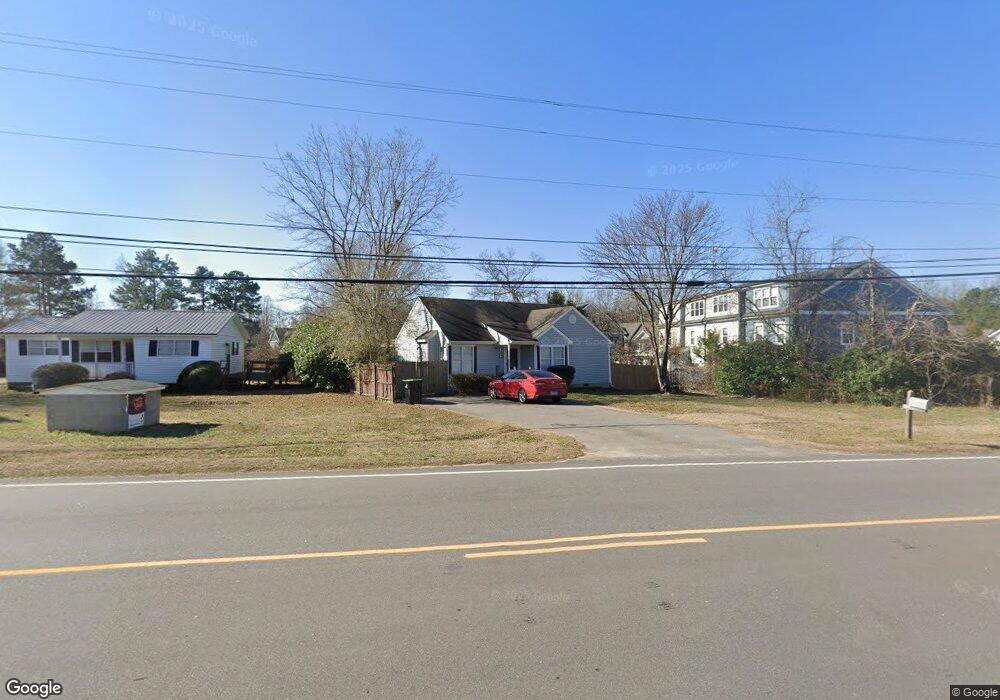
This home is located at 1110 Center St, Apex, NC 27502 and is currently estimated at $398,612, approximately $389 per square foot. 1110 Center St is a home located in Wake County with nearby schools including Apex Elementary School, Apex Middle, and Apex High School.
Ownership History
Date
Name
Owned For
Owner Type
Purchase Details
Closed on
Jan 28, 2019
Sold by
Lo Wen and Lo Francis T
Bought by
Lo Wen-Ken and Lo Francis T
Current Estimated Value
Purchase Details
Closed on
Feb 27, 2014
Sold by
Farrington-Hedgepeth Carolyn and Hedgepeth Carolyn Ann
Bought by
Lo Wen-Ken and Lo Francis T
Purchase Details
Closed on
Mar 25, 1999
Sold by
Macht Wade E
Bought by
Farrington Hedgepeth Carolyn
Home Financials for this Owner
Home Financials are based on the most recent Mortgage that was taken out on this home.
Original Mortgage
$85,164
Interest Rate
6.9%
Mortgage Type
FHA
Purchase Details
Closed on
Sep 14, 1998
Sold by
Matthews Charles Otis and Matthews Laura A
Bought by
Macht Wade and Pinnacle Homes
Home Financials for this Owner
Home Financials are based on the most recent Mortgage that was taken out on this home.
Original Mortgage
$21,500
Interest Rate
6.99%
Create a Home Valuation Report for This Property
The Home Valuation Report is an in-depth analysis detailing your home's value as well as a comparison with similar homes in the area
Home Values in the Area
Average Home Value in this Area
Purchase History
| Date | Buyer | Sale Price | Title Company |
|---|---|---|---|
| Lo Wen-Ken | -- | None Available | |
| Lo Wen-Ken | -- | None Listed On Document | |
| Lo Wen-Ken | $115,000 | None Available | |
| Farrington Hedgepeth Carolyn | $93,000 | -- | |
| Macht Wade | $21,500 | -- |
Source: Public Records
Mortgage History
| Date | Status | Borrower | Loan Amount |
|---|---|---|---|
| Previous Owner | Farrington Hedgepeth Carolyn | $85,164 | |
| Previous Owner | Macht Wade | $21,500 |
Source: Public Records
Tax History Compared to Growth
Tax History
| Year | Tax Paid | Tax Assessment Tax Assessment Total Assessment is a certain percentage of the fair market value that is determined by local assessors to be the total taxable value of land and additions on the property. | Land | Improvement |
|---|---|---|---|---|
| 2025 | -- | $363,392 | $200,000 | $163,392 |
| 2024 | $2,277 | $363,392 | $200,000 | $163,392 |
| 2023 | $1,927 | $244,564 | $130,000 | $114,564 |
| 2022 | $1,786 | $244,564 | $130,000 | $114,564 |
| 2021 | $1,739 | $244,564 | $130,000 | $114,564 |
| 2020 | $1,710 | $244,564 | $130,000 | $114,564 |
| 2019 | $1,756 | $212,593 | $125,000 | $87,593 |
| 2018 | $1,615 | $212,593 | $125,000 | $87,593 |
| 2017 | $1,532 | $212,593 | $125,000 | $87,593 |
| 2016 | $0 | $212,593 | $125,000 | $87,593 |
| 2015 | -- | $142,546 | $56,000 | $86,546 |
| 2014 | -- | $142,546 | $56,000 | $86,546 |
Source: Public Records
Map
Nearby Homes
- 295 Williams Grove Ln Unit Lot 67
- 285 Williams Grove Ln Unit Lot 65
- 281 Williams Grove Ln Unit Lot 64
- 281 Williams Grove Ln
- 298 Williams Grove Ln N Unit 68
- 294 Williams Grove Ln Unit 69
- 294 Williams Grove Ln
- 286 Williams Grove Ln Unit Lot 71
- 278 Williams Grove Ln Unit Lot 73
- 262 Williams Grove Ln Unit Lot 76
- 226 Williams Grove Ln
- 218 Williams Grove Ln
- 214 Williams Grove Ln Unit Lot 4
- 265 Williams Grove Ln
- 273 Williams Grove Ln Unit Lot 62
- 635 Sawcut Ln
- 631 Sawcut Ln
- 633 Sawcut Ln
- 1511 Waterland Dr
- 809 Green Passage Ln
- 1132 Center St
- 1405 Raines Meadow Dr
- 1407 Raines Meadow Dr
- 1403 Raines Meadow Dr
- 1409 Raines Meadow Dr
- 326 Old Grove Ln
- 324 Old Grove Ln
- 322 Old Grove Ln
- 320 Old Grove Ln
- 318 Old Grove Ln
- 116 Old Grove Ln
- 316 Old Grove Ln
- 112 Old Grove Ln
- 108 Old Grove Ln
- 1225 Center St
- 0 Center St
- 120 Old Grove Ln
- 832 Myrtle Grove Ln
- 832 Myrtle Grove Ln Unit B2
- 828 Myrtle Grove Ln