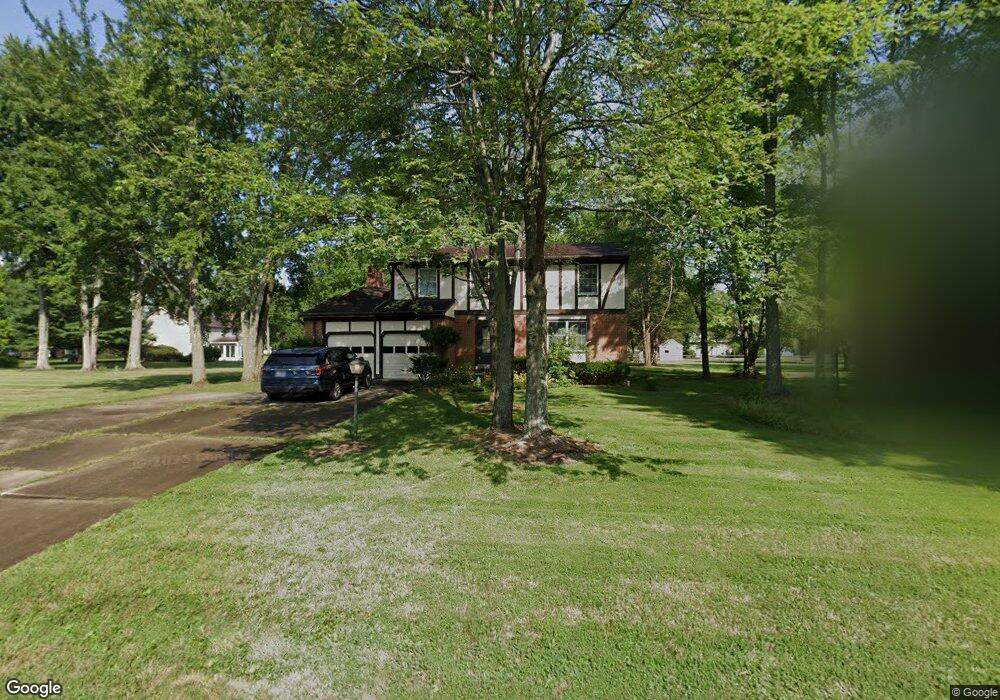
1110 Deerhaven Ct Loveland, OH 45140
Outer Loveland NeighborhoodEstimated Value: $387,581 - $468,000
4
Beds
3
Baths
2,093
Sq Ft
$207/Sq Ft
Est. Value
About This Home
This home is located at 1110 Deerhaven Ct, Loveland, OH 45140 and is currently estimated at $433,645, approximately $207 per square foot. 1110 Deerhaven Ct is a home located in Clermont County with nearby schools including Milford Senior High School, Milford Christian Academy, and St. Andrew - St. Elizabeth Ann Seton School.
Ownership History
Date
Name
Owned For
Owner Type
Purchase Details
Closed on
Feb 1, 2018
Sold by
Goldschmidt Barbara
Bought by
Goldschmidt Barbara
Current Estimated Value
Home Financials for this Owner
Home Financials are based on the most recent Mortgage that was taken out on this home.
Original Mortgage
$132,500
Outstanding Balance
$112,216
Interest Rate
3.99%
Mortgage Type
New Conventional
Estimated Equity
$321,429
Purchase Details
Closed on
Apr 27, 2007
Sold by
Bolander Derek S
Bought by
Bolander Barbara G
Purchase Details
Closed on
Apr 11, 2007
Sold by
Bolander Derek S
Bought by
Bolander Barbara G
Purchase Details
Closed on
Apr 2, 2002
Sold by
Plavsic Timothy A
Bought by
Bolander Derek S and Bolander Barbara G
Home Financials for this Owner
Home Financials are based on the most recent Mortgage that was taken out on this home.
Original Mortgage
$165,100
Interest Rate
6.93%
Mortgage Type
VA
Purchase Details
Closed on
Jul 1, 1988
Create a Home Valuation Report for This Property
The Home Valuation Report is an in-depth analysis detailing your home's value as well as a comparison with similar homes in the area
Home Values in the Area
Average Home Value in this Area
Purchase History
| Date | Buyer | Sale Price | Title Company |
|---|---|---|---|
| Goldschmidt Barbara | -- | -- | |
| Bolander Barbara G | -- | Attorney | |
| Bolander Barbara G | -- | Attorney | |
| Bolander Derek S | $161,900 | -- | |
| -- | $113,000 | -- |
Source: Public Records
Mortgage History
| Date | Status | Borrower | Loan Amount |
|---|---|---|---|
| Open | Goldschmidt Barbara | $132,500 | |
| Closed | Bolander Derek S | $165,100 |
Source: Public Records
Tax History Compared to Growth
Tax History
| Year | Tax Paid | Tax Assessment Tax Assessment Total Assessment is a certain percentage of the fair market value that is determined by local assessors to be the total taxable value of land and additions on the property. | Land | Improvement |
|---|---|---|---|---|
| 2024 | $4,316 | $93,350 | $19,430 | $73,920 |
| 2023 | $4,360 | $93,350 | $19,430 | $73,920 |
| 2022 | $4,322 | $70,630 | $14,700 | $55,930 |
| 2021 | $4,325 | $70,630 | $14,700 | $55,930 |
| 2020 | $4,147 | $70,630 | $14,700 | $55,930 |
| 2019 | $4,285 | $69,240 | $12,990 | $56,250 |
| 2018 | $4,287 | $69,240 | $12,990 | $56,250 |
| 2017 | $4,011 | $69,240 | $12,990 | $56,250 |
| 2016 | $4,075 | $59,680 | $11,200 | $48,480 |
| 2015 | $3,909 | $59,680 | $11,200 | $48,480 |
| 2014 | $3,741 | $59,680 | $11,200 | $48,480 |
| 2013 | $3,568 | $55,200 | $12,250 | $42,950 |
Source: Public Records
Map
Nearby Homes
- 6149 Century Farm Dr
- 6141 Brandywine Ct
- 1124 Clover Field Dr
- 1113 Clover Field Dr
- 1064 Weber Rd
- 6211 Spires Dr
- 1803 Wheatfield Way
- 2013 Weber Rd
- 6211 Cook Rd
- 6320 Ashford Dr
- 1140 Weber Rd
- 6077 Branch Hill Guinea Pike
- 5933 Firm Stance Dr
- 6108 Donna Jay Dr
- 1513 Charleston Ln
- 1706 Cottontail Dr
- 1285 State Rte 28
- 6379 Derbyshire Ln
- 1289 Woodville Pike
- 1376 Barre Ln