Estimated Value: $159,000 - $213,000
2
Beds
1
Bath
1,184
Sq Ft
$155/Sq Ft
Est. Value
About This Home
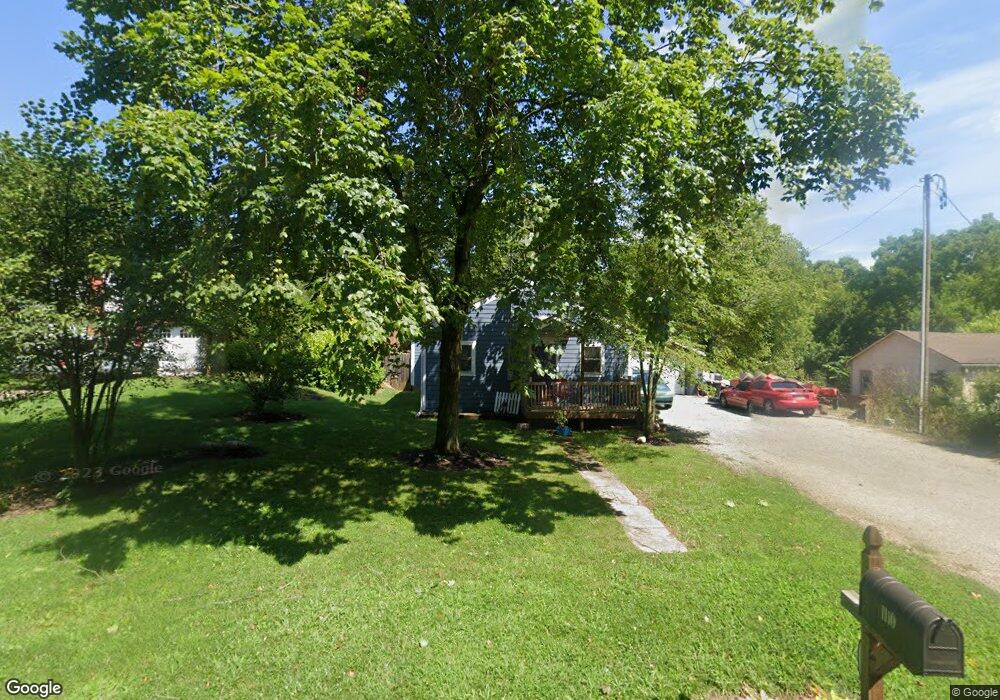
This home is located at 1110 Hook Rd, Xenia, OH 45385 and is currently estimated at $183,074, approximately $154 per square foot. 1110 Hook Rd is a home located in Greene County with nearby schools including Xenia High School, Summit Academy Community School for Alternative Learners - Xenia, and Legacy Christian Academy.
Ownership History
Date
Name
Owned For
Owner Type
Purchase Details
Closed on
Sep 30, 2022
Sold by
Wright Kenneth and Carter Jerica L
Bought by
Fuchs Nigel J
Current Estimated Value
Home Financials for this Owner
Home Financials are based on the most recent Mortgage that was taken out on this home.
Original Mortgage
$160,047
Outstanding Balance
$153,126
Interest Rate
6.25%
Mortgage Type
FHA
Estimated Equity
$29,948
Purchase Details
Closed on
Jun 18, 2021
Sold by
Hussey Bonnie J
Bought by
Wright Kenneth and Carter Jerica L
Home Financials for this Owner
Home Financials are based on the most recent Mortgage that was taken out on this home.
Original Mortgage
$61,500
Interest Rate
2.9%
Mortgage Type
New Conventional
Purchase Details
Closed on
Jun 28, 2000
Sold by
Delph James William
Bought by
Hussey Bonnie J
Home Financials for this Owner
Home Financials are based on the most recent Mortgage that was taken out on this home.
Original Mortgage
$50,400
Interest Rate
8.64%
Create a Home Valuation Report for This Property
The Home Valuation Report is an in-depth analysis detailing your home's value as well as a comparison with similar homes in the area
Purchase History
We collect this data history from publicly available records. To have your information removed, we recommend requesting removal directly through your county’s website.
| Date | Buyer | Sale Price | Title Company |
|---|---|---|---|
| Fuchs Nigel J | -- | None Listed On Document | |
| Wright Kenneth | $75,000 | None Available | |
| Hussey Bonnie J | $52,000 | -- |
Source: Public Records
Mortgage History
We collect this data history from publicly available records. To have your information removed, we recommend requesting removal directly through your county’s website.
| Date | Status | Borrower | Loan Amount |
|---|---|---|---|
| Open | Fuchs Nigel J | $160,047 | |
| Previous Owner | Wright Kenneth | $61,500 | |
| Previous Owner | Hussey Bonnie J | $50,400 |
Source: Public Records
Tax History
| Year | Tax Paid | Tax Assessment Tax Assessment Total Assessment is a certain percentage of the fair market value that is determined by local assessors to be the total taxable value of land and additions on the property. | Land | Improvement |
|---|---|---|---|---|
| 2025 | $1,479 | $30,170 | $10,230 | $19,940 |
| 2024 | $1,479 | $30,170 | $10,230 | $19,940 |
| 2023 | $1,467 | $30,170 | $10,230 | $19,940 |
| 2022 | $1,287 | $24,580 | $8,900 | $15,680 |
| 2021 | $1,303 | $24,580 | $8,900 | $15,680 |
| 2020 | $1,251 | $24,580 | $8,900 | $15,680 |
| 2019 | $787 | $14,530 | $8,010 | $6,520 |
| 2018 | $789 | $14,530 | $8,010 | $6,520 |
| 2017 | $768 | $14,530 | $8,010 | $6,520 |
| 2016 | $748 | $13,530 | $7,670 | $5,860 |
| 2015 | $750 | $13,530 | $7,670 | $5,860 |
| 2014 | $720 | $13,530 | $7,670 | $5,860 |
Source: Public Records
Map
Nearby Homes
- 0 U S 68
- 0 Gultice Rd Unit 955790
- 1217 Jasper Rd
- 1260 U S 68
- 1260 US Route 68 S
- 1119 Lee Ann Dr
- 770 S Columbus St
- 203 N Bickett Rd
- 591 Kennedy St
- 1353 Foust Rd
- 46 Lake St
- 1673 Foust Rd
- 0 Ohio 380
- 901 S Detroit St
- 0 E 2nd St
- 0 N Patton St
- 00 N Patton St
- 607 E Main St
- 680 S Detroit St
- 523 S Detroit St
Your Personal Tour Guide
Ask me questions while you tour the home.