1110 Hyde Ln Unit U-4 Henrico, VA 23229
Canterbury NeighborhoodEstimated Value: $528,824 - $582,000
2
Beds
4
Baths
1,800
Sq Ft
$305/Sq Ft
Est. Value
About This Home
This home is located at 1110 Hyde Ln Unit U-4, Henrico, VA 23229 and is currently estimated at $549,706, approximately $305 per square foot. 1110 Hyde Ln Unit U-4 is a home located in Henrico County with nearby schools including Tuckahoe Middle School, St. Mary's Catholic School, and West End Montessori School.
Ownership History
Date
Name
Owned For
Owner Type
Purchase Details
Closed on
Aug 5, 2021
Sold by
Dunn Christina J
Bought by
Wu Gang and Yin Chunhua
Current Estimated Value
Home Financials for this Owner
Home Financials are based on the most recent Mortgage that was taken out on this home.
Original Mortgage
$255,000
Outstanding Balance
$231,874
Interest Rate
2.9%
Mortgage Type
New Conventional
Estimated Equity
$317,832
Purchase Details
Closed on
Jul 10, 2013
Sold by
Thomas Roberta J
Bought by
Dunn Christina J
Home Financials for this Owner
Home Financials are based on the most recent Mortgage that was taken out on this home.
Original Mortgage
$80,000
Interest Rate
3.92%
Mortgage Type
New Conventional
Purchase Details
Closed on
May 14, 2010
Sold by
Gaskins And Patterson Inc
Bought by
Thomas Roberta J
Home Financials for this Owner
Home Financials are based on the most recent Mortgage that was taken out on this home.
Original Mortgage
$205,000
Interest Rate
5.11%
Mortgage Type
New Conventional
Create a Home Valuation Report for This Property
The Home Valuation Report is an in-depth analysis detailing your home's value as well as a comparison with similar homes in the area
Home Values in the Area
Average Home Value in this Area
Purchase History
| Date | Buyer | Sale Price | Title Company |
|---|---|---|---|
| Wu Gang | $425,000 | Attorney | |
| Dunn Christina J | $337,500 | -- | |
| Thomas Roberta J | $311,970 | -- |
Source: Public Records
Mortgage History
| Date | Status | Borrower | Loan Amount |
|---|---|---|---|
| Open | Wu Gang | $255,000 | |
| Previous Owner | Dunn Christina J | $80,000 | |
| Previous Owner | Thomas Roberta J | $205,000 |
Source: Public Records
Tax History Compared to Growth
Tax History
| Year | Tax Paid | Tax Assessment Tax Assessment Total Assessment is a certain percentage of the fair market value that is determined by local assessors to be the total taxable value of land and additions on the property. | Land | Improvement |
|---|---|---|---|---|
| 2025 | $4,319 | $469,300 | $100,000 | $369,300 |
| 2024 | $4,319 | $459,800 | $100,000 | $359,800 |
| 2023 | $3,908 | $459,800 | $100,000 | $359,800 |
| 2022 | $3,539 | $416,300 | $85,000 | $331,300 |
| 2021 | $3,245 | $365,600 | $75,000 | $290,600 |
| 2020 | $3,181 | $365,600 | $75,000 | $290,600 |
| 2019 | $2,968 | $341,100 | $65,000 | $276,100 |
| 2018 | $2,968 | $341,100 | $65,000 | $276,100 |
| 2017 | $2,991 | $343,800 | $65,000 | $278,800 |
| 2016 | $2,794 | $321,100 | $65,000 | $256,100 |
| 2015 | $2,729 | $313,700 | $65,000 | $248,700 |
| 2014 | $2,729 | $313,700 | $65,000 | $248,700 |
Source: Public Records
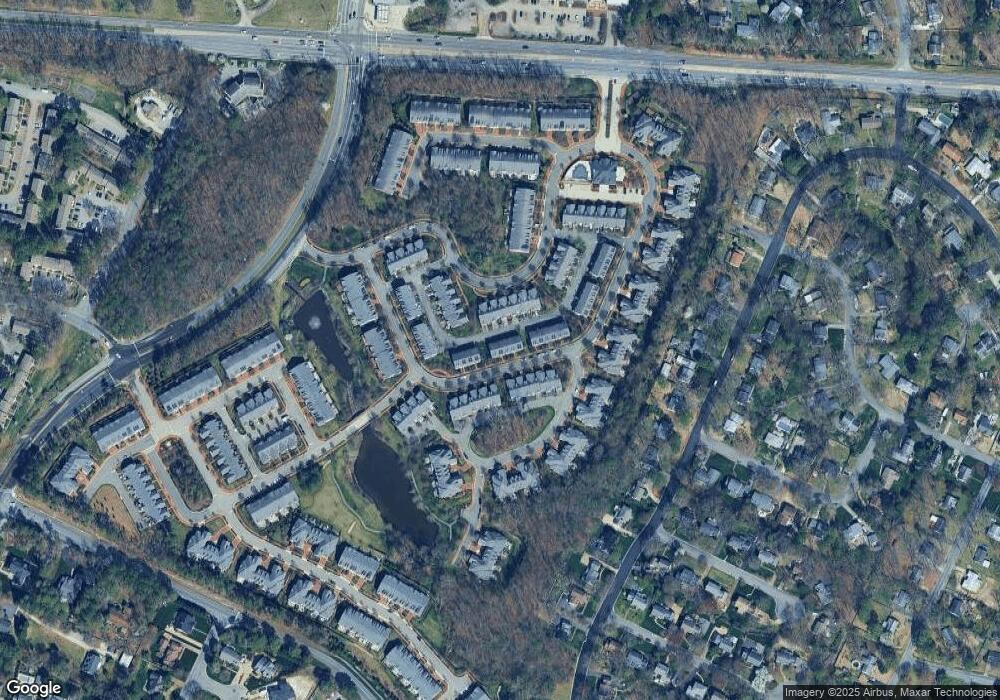
Map
Nearby Homes
- 1108 Hyde Ln
- 1213 Tilbury Ln
- 1203 Tilbury Ln
- 805 Kiftsgate Ct
- 1134 Marney Ct
- 805 Lakewater Dr
- 704 Chiswick Park Rd
- 1123 Marney Ct
- 1137 Marney Ct
- 9317 Westmoor Cir
- 9401 Derbyshire Rd
- 9017 Wood Sorrel Dr Unit 65
- 407 Lynchell Place
- 8957 Wishart Rd
- 9208 Gayton Rd
- 1303 Barnard Dr
- 1305 Barnard Dr
- 8810 Wishart Rd
- 9100 Gayton Rd
- 0000 Midway Rd
- 1110 Hyde Ln
- 1110 Hyde Ln Unit 1110 Hyde
- 1112 Hyde Ln
- 1112 Hyde Ln Unit 1112
- 1114 Hyde Ln
- 1114 Hyde Ln
- 1114 Hyde Ln Unit U-2
- 1114 Hyde Ln
- 1116 Hyde Ln
- 1116 Hyde Ln Unit U-1
- 1116 Hyde Ln Unit 1116
- 1106 Hyde Ln Unit 1106
- 1106 Hyde Ln
- 1106 Hyde Ln Unit V-1
- 1104 Hyde Ln
- 1104 Hyde Ln Unit V-2
- 1221 Tilbury Ln
- 1219 Tilbury Ln
- 1118 Hyde Ln
- 1118 Hyde Ln Unit 1118