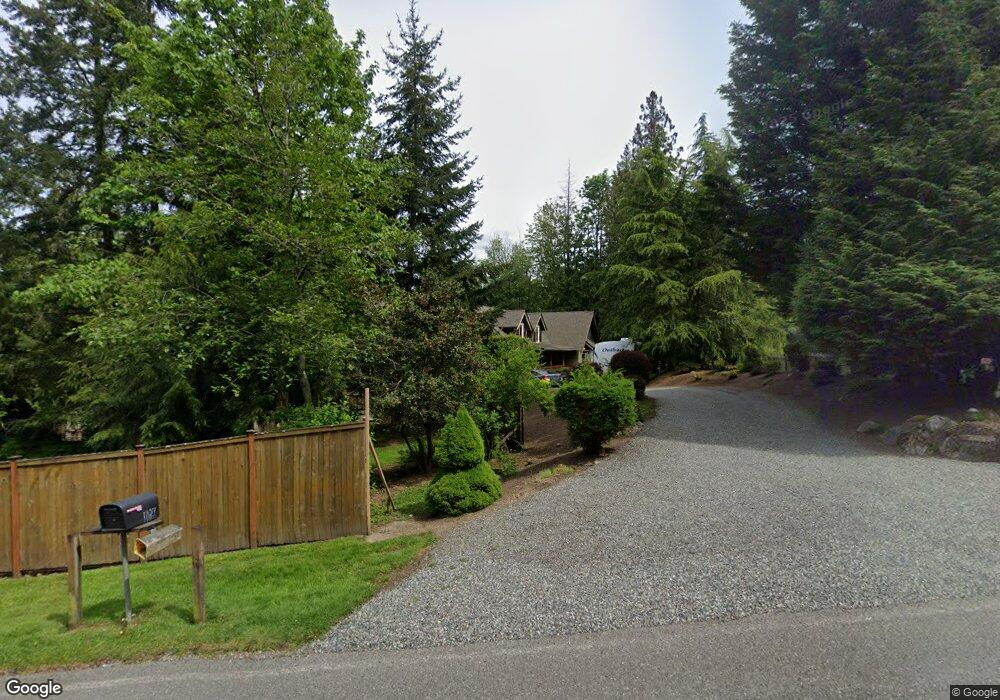
1110 Lakeview St Bellingham, WA 98229
Estimated Value: $1,027,000 - $1,224,000
4
Beds
4
Baths
3,421
Sq Ft
$322/Sq Ft
Est. Value
About This Home
This home is located at 1110 Lakeview St, Bellingham, WA 98229 and is currently estimated at $1,101,709, approximately $322 per square foot. 1110 Lakeview St is a home located in Whatcom County with nearby schools including Geneva Elementary School, Kulshan Middle School, and Bellingham High School.
Ownership History
Date
Name
Owned For
Owner Type
Purchase Details
Closed on
Apr 6, 2017
Sold by
Nevitt Robert O
Bought by
Nevitt Robert O and Nevitt Dayle
Current Estimated Value
Home Financials for this Owner
Home Financials are based on the most recent Mortgage that was taken out on this home.
Original Mortgage
$409,000
Outstanding Balance
$204,676
Interest Rate
3.32%
Mortgage Type
New Conventional
Estimated Equity
$897,033
Purchase Details
Closed on
May 22, 2009
Sold by
Roberts Renee Y and Roberts Bullman R
Bought by
Nevitt Robert O
Home Financials for this Owner
Home Financials are based on the most recent Mortgage that was taken out on this home.
Original Mortgage
$417,000
Interest Rate
4.8%
Mortgage Type
Purchase Money Mortgage
Create a Home Valuation Report for This Property
The Home Valuation Report is an in-depth analysis detailing your home's value as well as a comparison with similar homes in the area
Home Values in the Area
Average Home Value in this Area
Purchase History
| Date | Buyer | Sale Price | Title Company |
|---|---|---|---|
| Nevitt Robert O | -- | Whatcom Land Title Co Inc | |
| Nevitt Robert O | $560,180 | Whatcom Land Title |
Source: Public Records
Mortgage History
| Date | Status | Borrower | Loan Amount |
|---|---|---|---|
| Open | Nevitt Robert O | $409,000 | |
| Closed | Nevitt Robert O | $417,000 |
Source: Public Records
Tax History Compared to Growth
Tax History
| Year | Tax Paid | Tax Assessment Tax Assessment Total Assessment is a certain percentage of the fair market value that is determined by local assessors to be the total taxable value of land and additions on the property. | Land | Improvement |
|---|---|---|---|---|
| 2024 | $8,543 | $975,004 | $302,233 | $672,771 |
| 2023 | $8,543 | $999,828 | $309,928 | $689,900 |
| 2022 | $7,131 | $847,328 | $262,656 | $584,672 |
| 2021 | $6,711 | $661,975 | $205,200 | $456,775 |
| 2020 | $6,401 | $612,940 | $190,000 | $422,940 |
| 2019 | $5,955 | $572,914 | $179,820 | $393,094 |
| 2018 | $6,025 | $541,052 | $169,930 | $371,122 |
| 2017 | $5,261 | $466,245 | $146,043 | $320,202 |
| 2016 | $4,661 | $424,366 | $132,800 | $291,566 |
| 2015 | $4,660 | $393,664 | $125,267 | $268,397 |
| 2014 | -- | $0 | $0 | $0 |
| 2013 | -- | $404,484 | $123,900 | $280,584 |
Source: Public Records
Map
Nearby Homes
- 1328 Parkstone Ln
- 4750 Lost Creek Ln
- 4926 Coronado Ln
- 1555 Fairview St
- 1558 Fairview St
- 1120 Birch Falls Dr
- 0 Bonanza Way Unit NWM2327531
- 4000 Flynn St Unit 50
- 4000 Flynn St Unit 107
- 3108 NHN Northshore Rd
- 1211 Kenoyer Dr
- 2104 Birch Cir Unit 5C
- 2678 Strawberry Shore Dr
- 0 US Highway 27 Hwy N Unit MFRP4936152
- 0 US Highway 27 Hwy N Unit MFRP4935974
- 0 US Highway 27 Hwy N Unit MFRO6335808
- 0 US Highway 27 Hwy N Unit MFRL4957889
- 0 US Highway 27 Hwy N Unit MFRL4952111
- 2209 W Birch St
- 0 Princeton Ct
- 1116 Lakeview St
- 1106 Lakeview St
- 1120 Lakeview St
- 995 Lakewood Ln
- 1101 Lakeview St
- 1115 Lakeview St
- 1030 Lakeview St
- 4380 Lakehill Ln
- 1107 Lakeview St
- 4430 Fremont St
- 977 Lakewood Ln
- 4440 Fremont St
- 4424 Fremont St
- 4370 Lakehill Ln
- 0 Lakeview St
- 4448 Fremont St
- 971 Lakewood Ln
- 1103 Lakeview St
- 4379 Lakehill Ln
- 4360 Lakehill Ln