1110 Main St Lynchburg, VA 24504
Central Business District NeighborhoodEstimated Value: $337,691
--
Bed
--
Bath
2,825
Sq Ft
$120/Sq Ft
Est. Value
About This Home
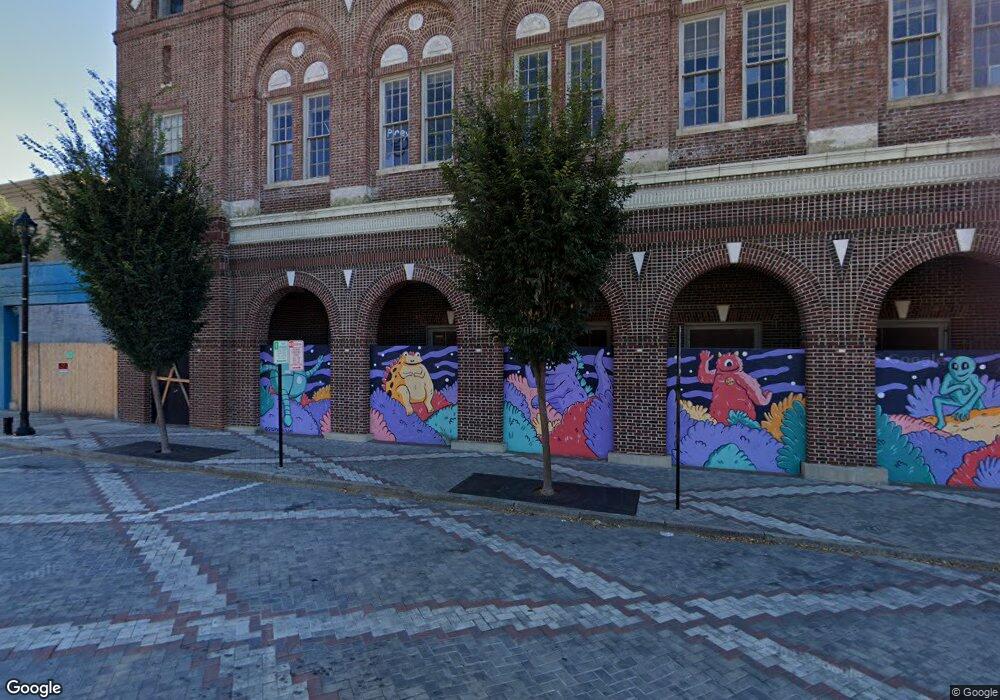
This home is located at 1110 Main St, Lynchburg, VA 24504 and is currently estimated at $337,691, approximately $119 per square foot. 1110 Main St is a home located in Lynchburg City with nearby schools including Perrymont Elementary School, Paul Laurence Dunbar Mid. for Innov., and Heritage High School.
Ownership History
Date
Name
Owned For
Owner Type
Purchase Details
Closed on
Jul 14, 2022
Sold by
Threethree Llc
Bought by
Shallow Creek Enterprises Llc
Current Estimated Value
Home Financials for this Owner
Home Financials are based on the most recent Mortgage that was taken out on this home.
Original Mortgage
$209,000
Outstanding Balance
$198,840
Interest Rate
5.09%
Mortgage Type
New Conventional
Estimated Equity
$138,851
Purchase Details
Closed on
Apr 2, 2018
Sold by
Central Virginia Criminal Justice Traini
Bought by
Threethree Llc
Home Financials for this Owner
Home Financials are based on the most recent Mortgage that was taken out on this home.
Original Mortgage
$97,500
Interest Rate
4.44%
Mortgage Type
Commercial
Create a Home Valuation Report for This Property
The Home Valuation Report is an in-depth analysis detailing your home's value as well as a comparison with similar homes in the area
Home Values in the Area
Average Home Value in this Area
Purchase History
| Date | Buyer | Sale Price | Title Company |
|---|---|---|---|
| Shallow Creek Enterprises Llc | $279,000 | Advantage Title & Closing | |
| Threethree Llc | $130,000 | None Available |
Source: Public Records
Mortgage History
| Date | Status | Borrower | Loan Amount |
|---|---|---|---|
| Open | Shallow Creek Enterprises Llc | $209,000 | |
| Previous Owner | Threethree Llc | $97,500 |
Source: Public Records
Tax History Compared to Growth
Tax History
| Year | Tax Paid | Tax Assessment Tax Assessment Total Assessment is a certain percentage of the fair market value that is determined by local assessors to be the total taxable value of land and additions on the property. | Land | Improvement |
|---|---|---|---|---|
| 2025 | $610 | $72,600 | $67,600 | $5,000 |
| 2024 | $646 | $72,600 | $67,600 | $5,000 |
| 2023 | $685 | $140,000 | $67,600 | $72,400 |
| 2022 | $1,066 | $103,500 | $67,600 | $35,900 |
| 2021 | $1,149 | $103,500 | $67,600 | $35,900 |
| 2020 | $1,302 | $117,300 | $67,600 | $49,700 |
| 2019 | $1,302 | $117,300 | $67,600 | $49,700 |
| 2018 | $1,240 | $111,700 | $51,700 | $60,000 |
| 2017 | $1,240 | $111,700 | $51,700 | $60,000 |
| 2016 | $1,240 | $111,700 | $51,700 | $60,000 |
| 2015 | -- | $111,700 | $51,700 | $60,000 |
| 2014 | -- | $111,700 | $51,700 | $60,000 |
Source: Public Records
Map
Nearby Homes
- 1022 Main St
- 1220 Main St Unit D
- 51 11th St Unit 16
- 1312 Clay St
- 611 13th St
- 508 Washington St
- 1500 Main St Unit 301
- 1020 Harrison St
- 1109 Harrison St
- 1401 Grace St
- 611 8th St
- 1415 Harrison St
- 1115 Jackson St
- 1706 Union St
- 906 8th St
- 1503 Jackson St
- 615 Federal St
- 620 Gum St
- 1814 E Lynch St
- 817 Polk St