Estimated Value: $295,000 - $317,000
3
Beds
3
Baths
1,784
Sq Ft
$171/Sq Ft
Est. Value
About This Home
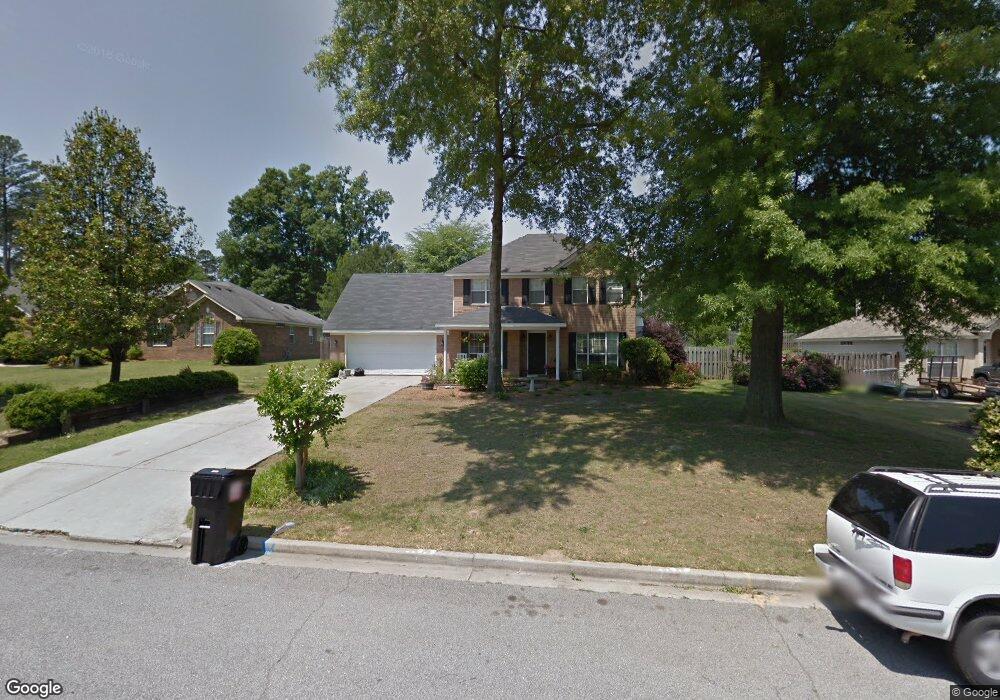
This home is located at 1110 Maple Ridge Ct, Evans, GA 30809 and is currently estimated at $305,359, approximately $171 per square foot. 1110 Maple Ridge Ct is a home located in Columbia County with nearby schools including Riverside Elementary School, Riverside Middle School, and Greenbrier High School.
Ownership History
Date
Name
Owned For
Owner Type
Purchase Details
Closed on
Jun 6, 2025
Sold by
Crowder K L
Bought by
Crowder Suzanne C and Crowder Kenneth Loren
Current Estimated Value
Purchase Details
Closed on
Mar 5, 2004
Sold by
Rhoden Anthony D and Rhoden Heather F
Bought by
Crowder Kenneth Loren and Crowder Suzanne C
Home Financials for this Owner
Home Financials are based on the most recent Mortgage that was taken out on this home.
Original Mortgage
$140,323
Interest Rate
5.68%
Mortgage Type
FHA
Purchase Details
Closed on
Sep 28, 2001
Sold by
Nordahl Homes Inc
Bought by
Rhoden Anthony D and Rhoden Heather F
Home Financials for this Owner
Home Financials are based on the most recent Mortgage that was taken out on this home.
Original Mortgage
$115,684
Interest Rate
6.89%
Mortgage Type
FHA
Purchase Details
Closed on
May 1, 2001
Sold by
Scherer Anne D
Bought by
Nordahl Homes Inc
Create a Home Valuation Report for This Property
The Home Valuation Report is an in-depth analysis detailing your home's value as well as a comparison with similar homes in the area
Home Values in the Area
Average Home Value in this Area
Purchase History
| Date | Buyer | Sale Price | Title Company |
|---|---|---|---|
| Crowder Suzanne C | -- | -- | |
| Crowder Kenneth Loren | $142,500 | -- | |
| Rhoden Anthony D | $117,500 | -- | |
| Nordahl Homes Inc | $130,000 | -- |
Source: Public Records
Mortgage History
| Date | Status | Borrower | Loan Amount |
|---|---|---|---|
| Previous Owner | Crowder Kenneth Loren | $140,323 | |
| Previous Owner | Rhoden Anthony D | $115,684 |
Source: Public Records
Tax History
| Year | Tax Paid | Tax Assessment Tax Assessment Total Assessment is a certain percentage of the fair market value that is determined by local assessors to be the total taxable value of land and additions on the property. | Land | Improvement |
|---|---|---|---|---|
| 2025 | $2,615 | $109,168 | $19,604 | $89,564 |
| 2024 | $2,530 | $100,857 | $18,304 | $82,553 |
| 2023 | $2,530 | $96,262 | $18,304 | $77,958 |
| 2022 | $2,160 | $82,800 | $15,604 | $67,196 |
| 2021 | $2,048 | $75,098 | $14,604 | $60,494 |
| 2020 | $2,183 | $78,446 | $15,304 | $63,142 |
| 2019 | $1,990 | $71,485 | $13,604 | $57,881 |
| 2018 | $2,057 | $73,645 | $13,604 | $60,041 |
| 2017 | $1,899 | $67,757 | $12,604 | $55,153 |
| 2016 | $1,680 | $62,120 | $11,080 | $51,040 |
| 2015 | $1,678 | $61,934 | $11,080 | $50,854 |
| 2014 | $1,641 | $59,848 | $11,580 | $48,268 |
Source: Public Records
Map
Nearby Homes
- 1127 Midford Ct
- 1357 Montrose Place
- 4537 Bellingham Ct
- 4599 Hardy McManus Rd
- 1139 Rivershyre Dr
- 1031,1041 Hardy Lake Rd
- 657 River Oaks Ln
- 667 River Oaks Ln
- 4533 Glastonbury Dr
- 4346 Azalea Dr
- 337 Gardenia Dr
- 2003 Lacebark Ct
- 5041 Sussex Dr
- 4998 Sussex Dr
- 565 River Oaks Ln
- 618 River Oaks Ln
- 616 River Oaks Ln
- 5008 Sussex Dr
- 310 Barnsley Dr
- 1432 Aylesbury Dr
- 1108 Maple Ridge Ct
- 1112 Maple Ridge Ct
- 1325 Maple Leaf Ct
- 1106 Maple Ridge Ct
- 1114 Maple Ridge Ct
- 1327 Maple Leaf Ct
- 1323 Maple Leaf Ct
- 1329 Maple Leaf Ct
- 1109 Maple Ridge Ct Unit 3
- 1109 Maple Ridge Ct
- 1321 Maple Leaf Ct
- 1107 Maple Ridge Ct
- 1116 Maple Ridge Ct
- 1331 Maple Leaf Ct Unit LOT 38
- 1331 Maple Leaf Ct
- 1105 Maple Ridge Ct
- 1104 Maple Ridge Ct
- 1118 Maple Ridge Ct
- 1103 Maple Ridge Ct
- 1324 Maple Leaf Ct