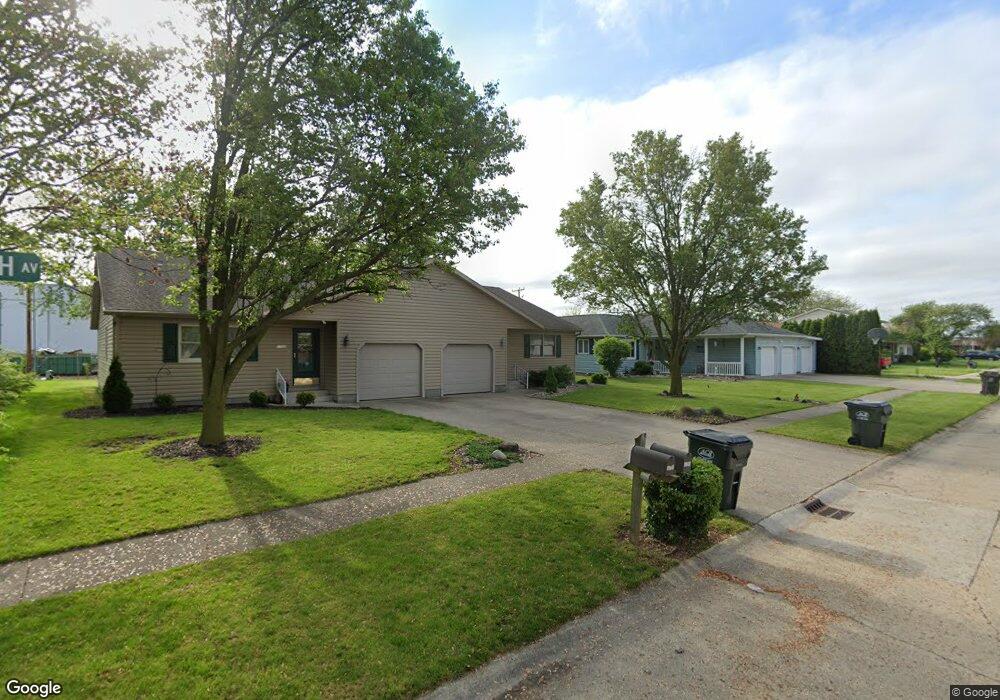
1110 Marsh Ave Delphos, OH 45833
Estimated Value: $110,000 - $264,000
4
Beds
2
Baths
2,384
Sq Ft
$80/Sq Ft
Est. Value
About This Home
This home is located at 1110 Marsh Ave, Delphos, OH 45833 and is currently estimated at $190,428, approximately $79 per square foot. 1110 Marsh Ave is a home located in Allen County with nearby schools including Delphos St. John's Elementary School.
Ownership History
Date
Name
Owned For
Owner Type
Purchase Details
Closed on
Jun 15, 2023
Sold by
Martin Dale L and Martin Susan M
Bought by
Martin Irrevocable Heritage Trust and Martin
Current Estimated Value
Purchase Details
Closed on
Sep 27, 2012
Sold by
Swartz Jonathan D
Bought by
Martin Dale L and Martin Susan M
Purchase Details
Closed on
Mar 31, 2008
Sold by
Swartz Enterprises Inc
Bought by
Swartz Jonathan D
Home Financials for this Owner
Home Financials are based on the most recent Mortgage that was taken out on this home.
Original Mortgage
$102,400
Interest Rate
6.32%
Mortgage Type
Purchase Money Mortgage
Purchase Details
Closed on
Mar 7, 1995
Sold by
Ricker Contracting Co
Bought by
T R Rentals
Purchase Details
Closed on
Jan 1, 1990
Bought by
Ricker Contracting Co
Create a Home Valuation Report for This Property
The Home Valuation Report is an in-depth analysis detailing your home's value as well as a comparison with similar homes in the area
Home Values in the Area
Average Home Value in this Area
Purchase History
| Date | Buyer | Sale Price | Title Company |
|---|---|---|---|
| Martin Irrevocable Heritage Trust | -- | None Listed On Document | |
| Martin Dale L | $137,500 | Attorney | |
| Swartz Jonathan D | $128,000 | Attorney | |
| T R Rentals | $13,500 | -- | |
| Ricker Contracting Co | -- | -- |
Source: Public Records
Mortgage History
| Date | Status | Borrower | Loan Amount |
|---|---|---|---|
| Previous Owner | Swartz Jonathan D | $102,400 |
Source: Public Records
Tax History Compared to Growth
Tax History
| Year | Tax Paid | Tax Assessment Tax Assessment Total Assessment is a certain percentage of the fair market value that is determined by local assessors to be the total taxable value of land and additions on the property. | Land | Improvement |
|---|---|---|---|---|
| 2024 | $2,070 | $65,490 | $9,280 | $56,210 |
| 2023 | $1,815 | $54,570 | $7,740 | $46,830 |
| 2022 | $1,860 | $54,570 | $7,740 | $46,830 |
| 2021 | $1,869 | $54,570 | $7,740 | $46,830 |
| 2020 | $1,578 | $48,130 | $7,280 | $40,850 |
| 2019 | $1,578 | $48,130 | $7,280 | $40,850 |
| 2018 | $1,574 | $48,130 | $7,280 | $40,850 |
| 2017 | $1,541 | $46,270 | $7,280 | $38,990 |
| 2016 | $1,555 | $46,270 | $7,280 | $38,990 |
| 2015 | $1,489 | $46,270 | $7,280 | $38,990 |
| 2014 | $1,489 | $43,820 | $7,000 | $36,820 |
| 2013 | $1,495 | $43,820 | $7,000 | $36,820 |
Source: Public Records
Map
Nearby Homes
- 1220 Rose Anna Dr
- 1303 Carolyn Dr
- 521 Carolyn Dr
- 716 Moening St
- 810 N Franklin St
- 704 N Franklin St
- 633 E 2nd St
- 610 N Washington St
- 405 N Franklin St
- 210 E 3rd St
- 7110 Elida Rd
- 221 S Main St
- 604 W 6th St
- 409 N Bredeick St
- 483 S Franklin St
- 424 S Canal St
- 516 S Main St
- 634 S Clay St
- 827 S Washington St
- 1001 S Adams St