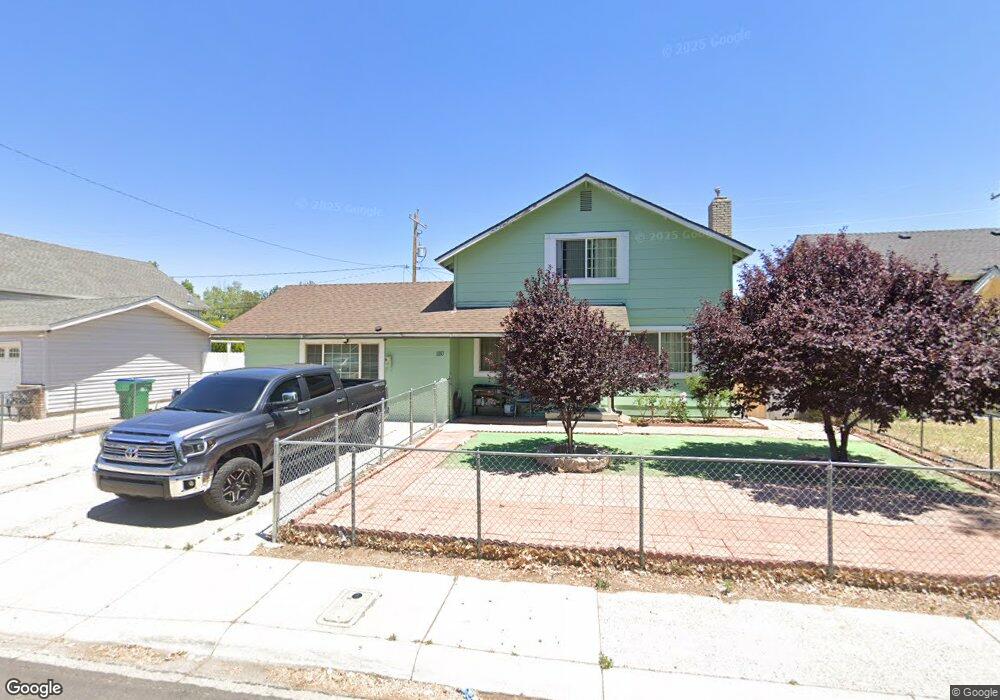
1110 Monitor Dr Reno, NV 89512
Northeast Reno NeighborhoodEstimated Value: $309,000 - $382,000
3
Beds
2
Baths
1,460
Sq Ft
$237/Sq Ft
Est. Value
About This Home
This home is located at 1110 Monitor Dr, Reno, NV 89512 and is currently estimated at $346,302, approximately $237 per square foot. 1110 Monitor Dr is a home located in Washoe County with nearby schools including Bernice Mathews Elementary School, Fred W. Traner Middle School, and Procter R. Hug High School.
Ownership History
Date
Name
Owned For
Owner Type
Purchase Details
Closed on
Feb 14, 2008
Sold by
Pinto Anabel D
Bought by
Pinto Anabel D and Pinto Sara
Current Estimated Value
Home Financials for this Owner
Home Financials are based on the most recent Mortgage that was taken out on this home.
Original Mortgage
$103,000
Interest Rate
5.85%
Mortgage Type
Unknown
Purchase Details
Closed on
Apr 23, 1998
Sold by
Pinto Anabel D and Pinto Sara
Bought by
Pinto Anabel D and Pinto Sara
Home Financials for this Owner
Home Financials are based on the most recent Mortgage that was taken out on this home.
Original Mortgage
$113,998
Interest Rate
7.06%
Mortgage Type
FHA
Purchase Details
Closed on
Jun 6, 1996
Sold by
Kleist Andrew W and Kleist Wanda J
Bought by
Pinto Anabel D and Pinto Sara Delcarmen
Home Financials for this Owner
Home Financials are based on the most recent Mortgage that was taken out on this home.
Original Mortgage
$111,708
Interest Rate
7.96%
Mortgage Type
FHA
Purchase Details
Closed on
Aug 24, 1994
Sold by
Jackson Beryl A
Bought by
Kleist Andrew W and Kleist Wanda J
Home Financials for this Owner
Home Financials are based on the most recent Mortgage that was taken out on this home.
Original Mortgage
$97,850
Interest Rate
8.8%
Create a Home Valuation Report for This Property
The Home Valuation Report is an in-depth analysis detailing your home's value as well as a comparison with similar homes in the area
Home Values in the Area
Average Home Value in this Area
Purchase History
| Date | Buyer | Sale Price | Title Company |
|---|---|---|---|
| Pinto Anabel D | -- | First Centennial Reno | |
| Pinto Anabel D | -- | First Centennial Reno | |
| Pinto Anabel D | -- | Founders Title Co | |
| Pinto Anabel D | $112,500 | Stewart Title | |
| Kleist Andrew W | $103,000 | Stewart Title |
Source: Public Records
Mortgage History
| Date | Status | Borrower | Loan Amount |
|---|---|---|---|
| Closed | Pinto Anabel D | $103,000 | |
| Previous Owner | Pinto Anabel D | $113,998 | |
| Previous Owner | Pinto Anabel D | $111,708 | |
| Previous Owner | Kleist Andrew W | $97,850 |
Source: Public Records
Tax History Compared to Growth
Tax History
| Year | Tax Paid | Tax Assessment Tax Assessment Total Assessment is a certain percentage of the fair market value that is determined by local assessors to be the total taxable value of land and additions on the property. | Land | Improvement |
|---|---|---|---|---|
| 2026 | -- | $48,083 | $27,720 | $20,363 |
| 2025 | $783 | $47,264 | $27,685 | $19,579 |
| 2024 | $783 | $46,805 | $27,510 | $19,295 |
| 2023 | $761 | $45,220 | $27,370 | $17,850 |
| 2022 | $739 | $37,490 | $22,960 | $14,530 |
| 2021 | $719 | $29,801 | $15,750 | $14,051 |
| 2020 | $697 | $28,057 | $14,140 | $13,917 |
| 2019 | $676 | $26,784 | $13,650 | $13,134 |
| 2018 | $657 | $23,036 | $10,430 | $12,606 |
| 2017 | $639 | $22,356 | $9,835 | $12,521 |
| 2016 | $622 | $21,374 | $8,820 | $12,554 |
| 2015 | $621 | $19,089 | $6,895 | $12,194 |
| 2014 | $603 | $16,956 | $5,460 | $11,496 |
| 2013 | -- | $15,868 | $4,690 | $11,178 |
Source: Public Records
Map
Nearby Homes
- 168 Poppy Ln
- 135 Carnation Ln
- 112 Lilac Ln
- 113 Lilac Ln
- 1885 Castle Way
- 1990 Trainer Way
- 2301 Oddie Blvd Unit 56
- 2301 Oddie Blvd Unit 162
- 2301 Oddie Blvd Unit 18
- 2335 Roundhouse Rd
- 2380 Roundhouse Rd
- 2090 Fife Dr
- 1414 E 9th St Unit 4
- 920 Montello St
- 2371 Roundhouse Rd
- 2282 Cannonball Rd
- 2136 Roundhouse Rd
- 2168 Cannonball Rd
- 1436 E 9th St Unit 8
- 1281 E 10th St
- 1120 Monitor Dr
- 1155 Silverada Blvd
- 1070 Monitor Dr
- 1140 Monitor Dr
- 1115 Monitor Dr
- 1095 Monitor Dr
- 1125 Monitor Dr
- 1215 Silverada Blvd
- 1125 Silverada Blvd
- 1075 Monitor Dr
- 1060 Monitor Dr
- 1145 Monitor Dr
- 1095 Silverada Blvd
- 1235 Silverada Blvd
- 1138 Nyala St
- 1065 Monitor Dr
- 1200 Silverada Blvd
- 1190 Silverada Blvd
- 1165 Monitor Dr
- 1040 Monitor Dr