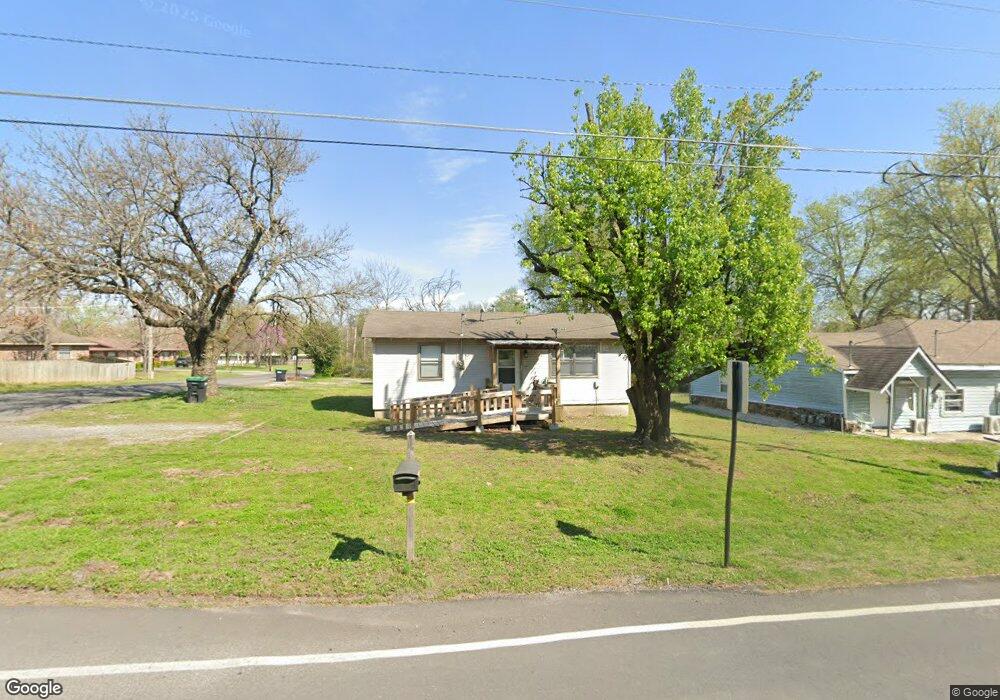
1110 N Jones Ave Tahlequah, OK 74464
Estimated Value: $95,000 - $135,000
2
Beds
1
Bath
768
Sq Ft
$146/Sq Ft
Est. Value
About This Home
This home is located at 1110 N Jones Ave, Tahlequah, OK 74464 and is currently estimated at $112,293, approximately $146 per square foot. 1110 N Jones Ave is a home located in Cherokee County with nearby schools including Cherokee Elementary School, Greenwood Elementary School, and Tahlequah Middle School.
Ownership History
Date
Name
Owned For
Owner Type
Purchase Details
Closed on
Jan 19, 2023
Sold by
Cain Lucille
Bought by
Housing Authority Of The Cherokee Nation Of O
Current Estimated Value
Purchase Details
Closed on
Oct 7, 2022
Sold by
Kirk Latosha Dawnelle
Bought by
Cain Lucille and Kirk Velma
Purchase Details
Closed on
Jun 11, 2010
Sold by
Culver Jeena
Bought by
Kirk Latosha Dawnelle
Home Financials for this Owner
Home Financials are based on the most recent Mortgage that was taken out on this home.
Original Mortgage
$51,964
Interest Rate
5.02%
Mortgage Type
FHA
Purchase Details
Closed on
Jun 1, 2007
Sold by
Hicks Jerod
Bought by
Culver Jeena
Purchase Details
Closed on
Apr 19, 2001
Sold by
Leon and Regina Hicks
Bought by
Jerod Hicks
Purchase Details
Closed on
Sep 16, 1995
Sold by
Jimmy Kinsey
Bought by
Leon and Regina Hicks
Create a Home Valuation Report for This Property
The Home Valuation Report is an in-depth analysis detailing your home's value as well as a comparison with similar homes in the area
Home Values in the Area
Average Home Value in this Area
Purchase History
| Date | Buyer | Sale Price | Title Company |
|---|---|---|---|
| Housing Authority Of The Cherokee Nation Of O | -- | -- | |
| Cain Lucille | $55,000 | Green Counitryabstract And Tit | |
| Kirk Latosha Dawnelle | $62,500 | None Available | |
| Culver Jeena | $58,000 | Heritage Title | |
| Jerod Hicks | -- | -- | |
| Leon | $27,000 | -- |
Source: Public Records
Mortgage History
| Date | Status | Borrower | Loan Amount |
|---|---|---|---|
| Previous Owner | Kirk Latosha Dawnelle | $51,964 |
Source: Public Records
Tax History Compared to Growth
Tax History
| Year | Tax Paid | Tax Assessment Tax Assessment Total Assessment is a certain percentage of the fair market value that is determined by local assessors to be the total taxable value of land and additions on the property. | Land | Improvement |
|---|---|---|---|---|
| 2025 | $384 | $6,050 | $1,029 | $5,021 |
| 2024 | $384 | $6,050 | $998 | $5,052 |
| 2023 | $384 | $6,050 | $723 | $5,327 |
| 2022 | $416 | $5,485 | $723 | $4,762 |
| 2021 | $418 | $5,485 | $723 | $4,762 |
| 2020 | $425 | $5,485 | $723 | $4,762 |
| 2019 | $421 | $5,485 | $723 | $4,762 |
| 2018 | $439 | $5,618 | $723 | $4,895 |
| 2017 | $438 | $5,618 | $723 | $4,895 |
| 2016 | $441 | $5,618 | $723 | $4,895 |
| 2015 | $553 | $6,891 | $723 | $6,168 |
| 2014 | $553 | $6,876 | $825 | $6,051 |
Source: Public Records
Map
Nearby Homes
- 1108 N Jones Ave
- 402 Minor St
- 1325 N Vinita Ave
- 916 Coy Ave
- 2020 N Everly Dr
- 2021 N Everly Dr
- 2000 N Everly Dr
- 1930 N Everly Dr
- 2010 N Everly Dr
- 2030 N Everly Dr
- 2031 N Everly Dr
- 2040 N Everly Dr
- 310 York St
- 1406 Skipper Ave
- 511 W Allen Rd
- 1408 Trimble Ave
- 702 N Jones Ave
- 615 Russell Ave
- 780 W Southlake Dr
- 3063 Mountain