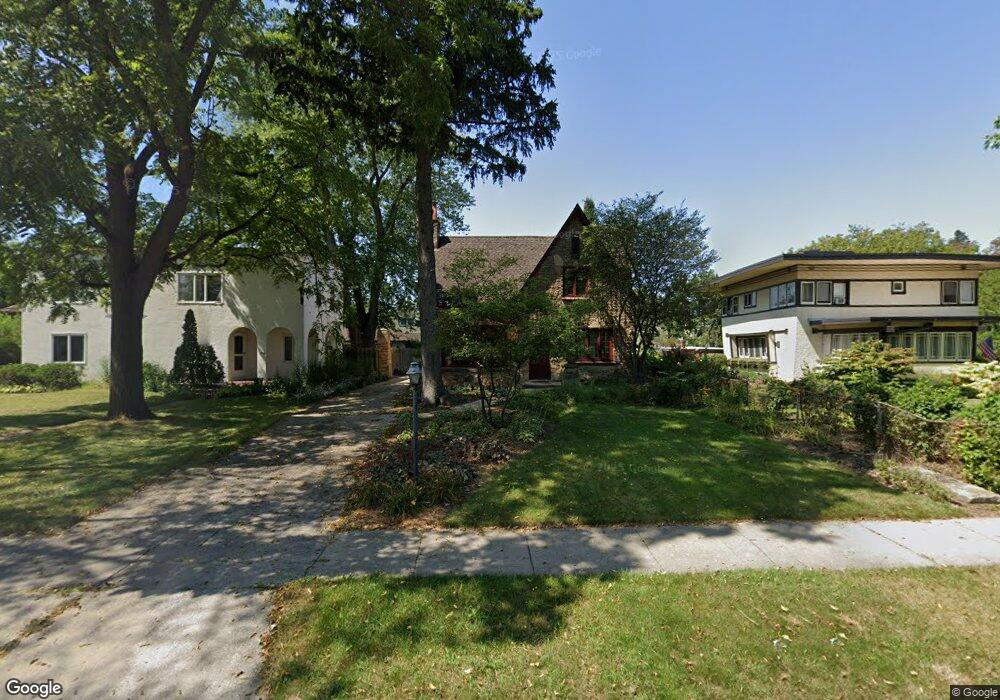
1110 N Sheridan Rd Waukegan, IL 60085
Estimated Value: $278,053 - $330,000
3
Beds
2
Baths
2,158
Sq Ft
$138/Sq Ft
Est. Value
About This Home
This home is located at 1110 N Sheridan Rd, Waukegan, IL 60085 and is currently estimated at $297,513, approximately $137 per square foot. 1110 N Sheridan Rd is a home located in Lake County with nearby schools including Greenwood Elementary School, Edith M Smith Middle School, and Waukegan High School.
Ownership History
Date
Name
Owned For
Owner Type
Purchase Details
Closed on
Mar 27, 2024
Sold by
Gutierrez Antonio S and Chelap Michelle
Bought by
Chelap-Gutierrez Family Trust and Gutierrez
Current Estimated Value
Purchase Details
Closed on
Apr 20, 2005
Sold by
Chelap Michelle and Gutierrez Antonio S
Bought by
Gutierrez Antonio S and Chelap Michelle
Purchase Details
Closed on
May 17, 1999
Sold by
Chelap Stephen
Bought by
Chelap Michelle and Gutierrez Antonio S
Home Financials for this Owner
Home Financials are based on the most recent Mortgage that was taken out on this home.
Original Mortgage
$95,000
Interest Rate
6.92%
Create a Home Valuation Report for This Property
The Home Valuation Report is an in-depth analysis detailing your home's value as well as a comparison with similar homes in the area
Home Values in the Area
Average Home Value in this Area
Purchase History
| Date | Buyer | Sale Price | Title Company |
|---|---|---|---|
| Chelap-Gutierrez Family Trust | -- | None Listed On Document | |
| Gutierrez Antonio S | -- | Mid America Title Company | |
| Chelap Michelle | $123,000 | First American Title |
Source: Public Records
Mortgage History
| Date | Status | Borrower | Loan Amount |
|---|---|---|---|
| Previous Owner | Chelap Michelle | $95,000 |
Source: Public Records
Tax History Compared to Growth
Tax History
| Year | Tax Paid | Tax Assessment Tax Assessment Total Assessment is a certain percentage of the fair market value that is determined by local assessors to be the total taxable value of land and additions on the property. | Land | Improvement |
|---|---|---|---|---|
| 2024 | $5,873 | $78,001 | $9,961 | $68,040 |
| 2023 | $6,284 | $70,281 | $8,918 | $61,363 |
| 2022 | $6,284 | $70,278 | $8,988 | $61,290 |
| 2021 | $5,656 | $60,246 | $8,018 | $52,228 |
| 2020 | $5,682 | $56,127 | $7,470 | $48,657 |
| 2019 | $5,666 | $51,431 | $6,845 | $44,586 |
| 2018 | $4,802 | $43,520 | $7,887 | $35,633 |
| 2017 | $4,624 | $38,503 | $6,978 | $31,525 |
| 2016 | $4,243 | $33,458 | $6,064 | $27,394 |
| 2015 | $4,045 | $29,945 | $5,427 | $24,518 |
| 2014 | $4,621 | $32,851 | $6,069 | $26,782 |
| 2012 | $5,947 | $35,591 | $6,576 | $29,015 |
Source: Public Records
Map
Nearby Homes
- 415 W Ridgeland Ave
- 723 N County St
- 1110 N Ash St
- 1122 N Ash St
- 325 4th St
- 918 N Ash St
- 611 N Genesee St
- 1336 N Ash St
- 1335 Chestnut St
- 1613 North Ave
- 620 N Poplar St
- 616 W Keith Ave
- 702 Franklin St
- 452 North Ave
- 522 N Poplar St
- 917 N Linden Ave
- 428 N Poplar St
- 1105 Woodlawn Cir
- 511 Chestnut St
- 1312 N Linden Ave
- 1106 N Sheridan Rd
- 1114 N Sheridan Rd
- 218 Stewart Ave
- 222 Stewart Ave
- 1034 N Sheridan Rd
- 1122 N Sheridan Rd
- 226 Stewart Ave
- 230 Stewart Ave
- 1109 N Sheridan Rd
- 219 Stewart Ave Unit 221
- 219 Stewart Ave
- 1113 Douglas Ct
- 1117 N Sheridan Rd
- 1130 N Sheridan Rd
- 1117 Douglas Ct
- 223 Stewart Ave
- 1101 N Sheridan Rd
- 234 Stewart Ave
- 215 Douglas Ave
- 1026 N Sheridan Rd