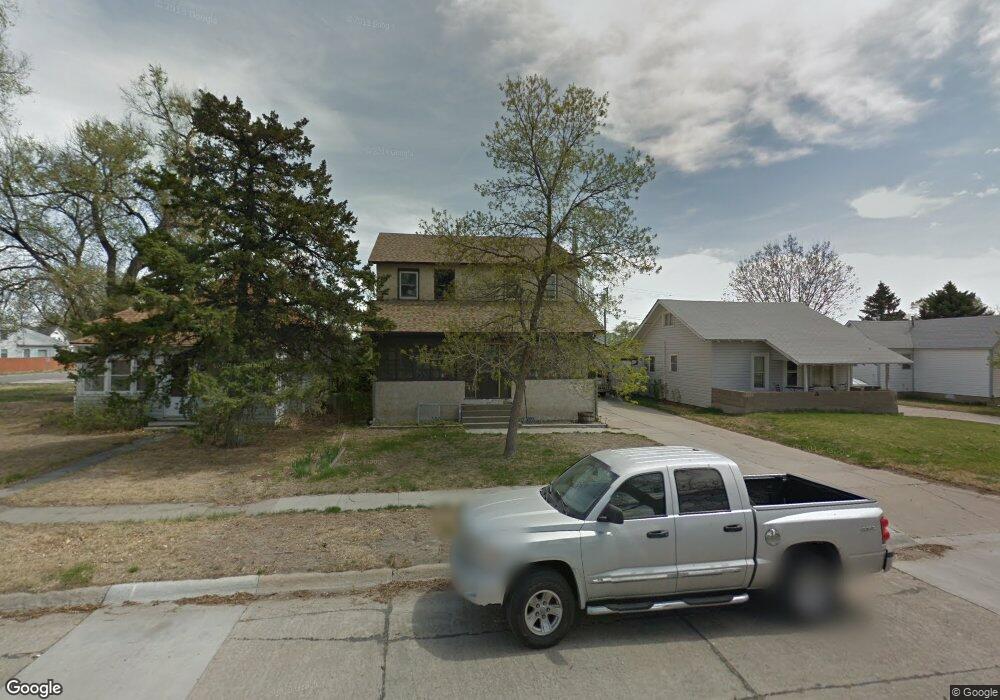
1110 O St Bridgeport, NE 69336
Estimated Value: $107,000 - $218,000
5
Beds
2
Baths
1,904
Sq Ft
$85/Sq Ft
Est. Value
About This Home
This home is located at 1110 O St, Bridgeport, NE 69336 and is currently estimated at $162,686, approximately $85 per square foot. 1110 O St is a home located in Morrill County with nearby schools including Bridgeport Elementary School and Bridgeport High School.
Ownership History
Date
Name
Owned For
Owner Type
Purchase Details
Closed on
Feb 17, 2016
Sold by
Macomber Janice C and Macomber Daniel C
Bought by
Dobrinski Holly F
Current Estimated Value
Purchase Details
Closed on
Mar 21, 1995
Bought by
Macomber Janice C and Macomber Daniel C
Create a Home Valuation Report for This Property
The Home Valuation Report is an in-depth analysis detailing your home's value as well as a comparison with similar homes in the area
Home Values in the Area
Average Home Value in this Area
Purchase History
| Date | Buyer | Sale Price | Title Company |
|---|---|---|---|
| Dobrinski Holly F | $65,000 | -- | |
| Macomber Janice C | -- | -- |
Source: Public Records
Tax History Compared to Growth
Tax History
| Year | Tax Paid | Tax Assessment Tax Assessment Total Assessment is a certain percentage of the fair market value that is determined by local assessors to be the total taxable value of land and additions on the property. | Land | Improvement |
|---|---|---|---|---|
| 2025 | $1,449 | $104,680 | $9,240 | $95,440 |
| 2024 | $1,449 | $104,680 | $9,240 | $95,440 |
| 2023 | $1,364 | $76,205 | $4,620 | $71,585 |
| 2022 | $1,376 | $67,415 | $4,620 | $62,795 |
| 2021 | $1,346 | $66,680 | $4,620 | $62,060 |
| 2020 | $1,347 | $66,680 | $4,620 | $62,060 |
| 2019 | $1,168 | $58,120 | $4,620 | $53,500 |
| 2018 | $1,139 | $56,210 | $4,620 | $51,590 |
| 2017 | $1,152 | $56,210 | $4,620 | $51,590 |
| 2016 | $1,146 | $56,210 | $4,620 | $51,590 |
| 2015 | $763 | $37,495 | $4,620 | $32,875 |
| 2014 | $754 | $37,495 | $4,620 | $32,875 |
| 2013 | $721 | $37,495 | $4,620 | $32,875 |
Source: Public Records
Map
Nearby Homes