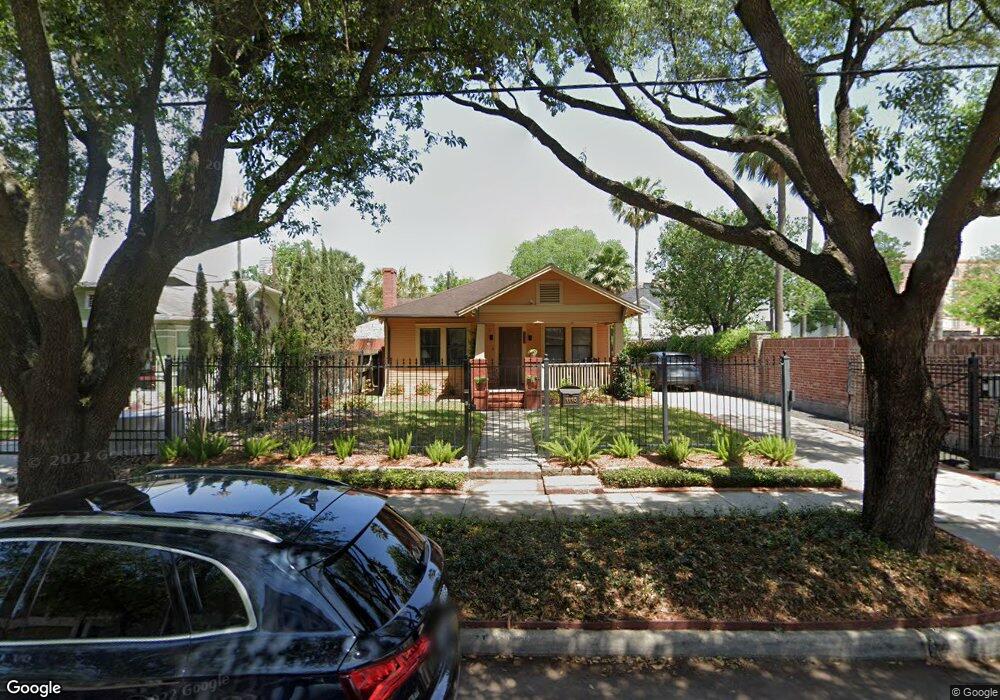
1110 Peden St Unit 6 Houston, TX 77006
Montrose NeighborhoodEstimated Value: $699,764 - $799,000
2
Beds
2
Baths
3,250
Sq Ft
$235/Sq Ft
Est. Value
About This Home
This home is located at 1110 Peden St Unit 6, Houston, TX 77006 and is currently estimated at $763,691, approximately $234 per square foot. 1110 Peden St Unit 6 is a home located in Harris County with nearby schools including Wharton Dual Language Academy, Gregory-Lincoln Ed Center, and Lamar High School.
Ownership History
Date
Name
Owned For
Owner Type
Purchase Details
Closed on
Feb 28, 2024
Sold by
Zweback Stanley and Zweback Dianne B
Bought by
Ghandour Enterprises Llc
Current Estimated Value
Purchase Details
Closed on
Jan 2, 2014
Sold by
Mcgee Printis M and Lehmann Jack T
Bought by
Zweback Stanley and Zweback Dianne B
Purchase Details
Closed on
Sep 10, 2003
Sold by
Mcgee Printis M
Bought by
Mcgee Printis M and Lehmann Jack T
Home Financials for this Owner
Home Financials are based on the most recent Mortgage that was taken out on this home.
Original Mortgage
$143,000
Interest Rate
6.31%
Mortgage Type
Credit Line Revolving
Purchase Details
Closed on
Nov 4, 1996
Sold by
Roensch Howard and Campbell Lynette
Bought by
Mcgee Printis M
Create a Home Valuation Report for This Property
The Home Valuation Report is an in-depth analysis detailing your home's value as well as a comparison with similar homes in the area
Home Values in the Area
Average Home Value in this Area
Purchase History
| Date | Buyer | Sale Price | Title Company |
|---|---|---|---|
| Ghandour Enterprises Llc | -- | None Listed On Document | |
| Zweback Stanley | -- | Charter Title | |
| Mcgee Printis M | -- | American Title Company | |
| Mcgee Printis M | -- | -- |
Source: Public Records
Mortgage History
| Date | Status | Borrower | Loan Amount |
|---|---|---|---|
| Previous Owner | Mcgee Printis M | $143,000 |
Source: Public Records
Tax History Compared to Growth
Tax History
| Year | Tax Paid | Tax Assessment Tax Assessment Total Assessment is a certain percentage of the fair market value that is determined by local assessors to be the total taxable value of land and additions on the property. | Land | Improvement |
|---|---|---|---|---|
| 2025 | $5,473 | -- | -- | -- |
| 2024 | $5,473 | $760,158 | $698,500 | $61,658 |
| 2023 | $5,473 | $761,061 | $698,500 | $62,561 |
| 2022 | $13,585 | $633,147 | $571,500 | $61,647 |
| 2021 | $13,073 | $612,993 | $571,500 | $41,493 |
| 2020 | $12,348 | $601,424 | $571,500 | $29,924 |
| 2019 | $11,730 | $544,681 | $510,750 | $33,931 |
| 2018 | $5,983 | $421,411 | $368,875 | $52,536 |
| 2017 | $11,182 | $421,411 | $368,875 | $52,536 |
| 2016 | $11,182 | $421,411 | $368,875 | $52,536 |
| 2015 | -- | $421,411 | $368,875 | $52,536 |
| 2014 | -- | $356,184 | $306,450 | $49,734 |
Source: Public Records
Map
Nearby Homes
- 1116 Peden St
- 1220 W Gray St
- 1213 W Pierce St
- 1128 W Pierce St
- 1215 W Pierce St
- 1201 Bomar St
- 1215 W Bell St
- 1419 Montrose Blvd Unit 301
- 1014 Peden St Unit A
- 1014 Peden St Unit B
- 1242 Peden St
- 1239 W Pierce St
- 1119 Willard St
- 1209 Willard St
- 920 Peden St
- 1304 Peden St
- 1222 Marconi St
- 1305 W Bell St
- 1311 Peden St
- 1313 Peden St
- 1110 Peden St
- 1108 Peden St Unit A
- 1108 Peden St
- 1112 Peden St
- 1112 Peden St Unit A
- 1112 Peden St Unit B
- 1114 Peden St
- 1125 W Gray St
- 1123 W Gray St
- 1129 W Gray St
- 1121 W Gray St
- 1121 W Gray St
- 1133 W Gray St
- 1133 W Gray St Unit 1 & 2
- 1133 W Gray St Unit A
- 1133 W Gray St Unit 2
- 1621 Van Buren St
- 1619 Van Buren St
- 1700 Montrose Blvd
- 1118 Peden St