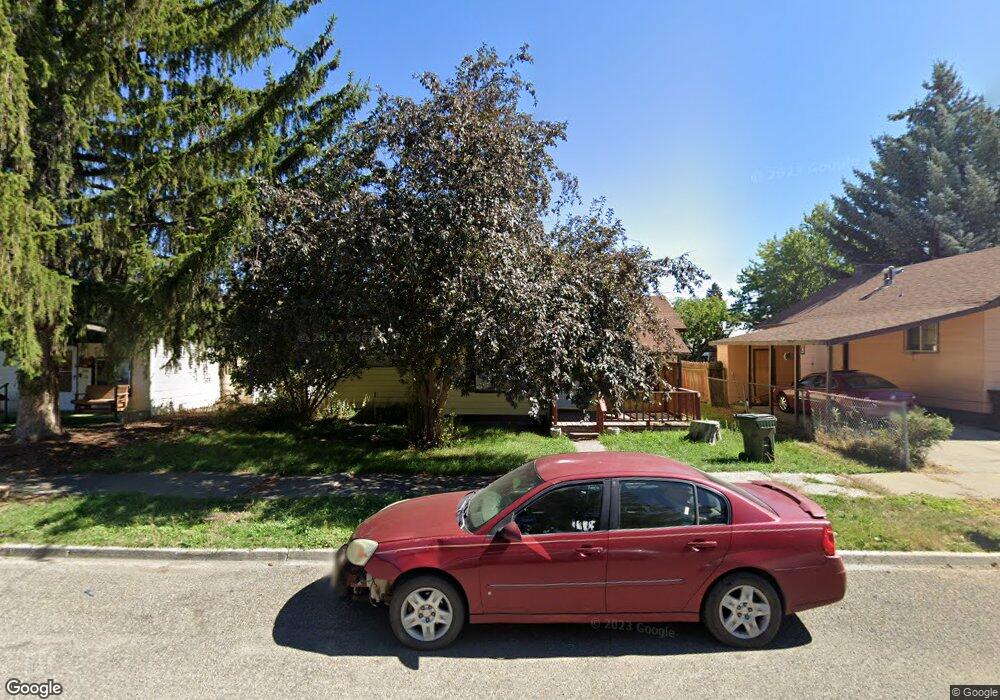
1110 Resort St Baker City, OR 97814
Estimated Value: $143,580 - $203,000
2
Beds
1
Bath
928
Sq Ft
$183/Sq Ft
Est. Value
About This Home
This home is located at 1110 Resort St, Baker City, OR 97814 and is currently estimated at $169,895, approximately $183 per square foot. 1110 Resort St is a home located in Baker County with nearby schools including Brooklyn Primary School, Baker Middle School, and Baker High School.
Ownership History
Date
Name
Owned For
Owner Type
Purchase Details
Closed on
Feb 24, 2020
Sold by
Fox John M
Bought by
Hixenbaugh James E
Current Estimated Value
Home Financials for this Owner
Home Financials are based on the most recent Mortgage that was taken out on this home.
Original Mortgage
$49,094
Outstanding Balance
$43,562
Interest Rate
3.6%
Mortgage Type
Construction
Estimated Equity
$126,333
Create a Home Valuation Report for This Property
The Home Valuation Report is an in-depth analysis detailing your home's value as well as a comparison with similar homes in the area
Home Values in the Area
Average Home Value in this Area
Purchase History
| Date | Buyer | Sale Price | Title Company |
|---|---|---|---|
| Hixenbaugh James E | $50,000 | Elkhorn Title Co |
Source: Public Records
Mortgage History
| Date | Status | Borrower | Loan Amount |
|---|---|---|---|
| Open | Hixenbaugh James E | $49,094 |
Source: Public Records
Tax History Compared to Growth
Tax History
| Year | Tax Paid | Tax Assessment Tax Assessment Total Assessment is a certain percentage of the fair market value that is determined by local assessors to be the total taxable value of land and additions on the property. | Land | Improvement |
|---|---|---|---|---|
| 2024 | $1,191 | $67,246 | $25,942 | $41,304 |
| 2023 | $1,168 | $65,288 | $25,698 | $39,590 |
| 2022 | $1,136 | $63,387 | $27,936 | $35,451 |
| 2021 | $1,101 | $61,541 | $29,933 | $31,608 |
| 2020 | $1,008 | $59,749 | $30,366 | $29,383 |
| 2019 | $958 | $58,009 | $27,136 | $30,873 |
| 2018 | $859 | $56,320 | $25,225 | $31,095 |
| 2017 | $820 | $54,680 | $24,490 | $30,190 |
| 2016 | $770 | $51,340 | $24,330 | $27,010 |
| 2015 | $809 | $53,373 | $24,336 | $29,037 |
| 2014 | $780 | $51,819 | $23,793 | $28,026 |
| 2013 | -- | $50,310 | $23,100 | $27,210 |
Source: Public Records
Map
Nearby Homes