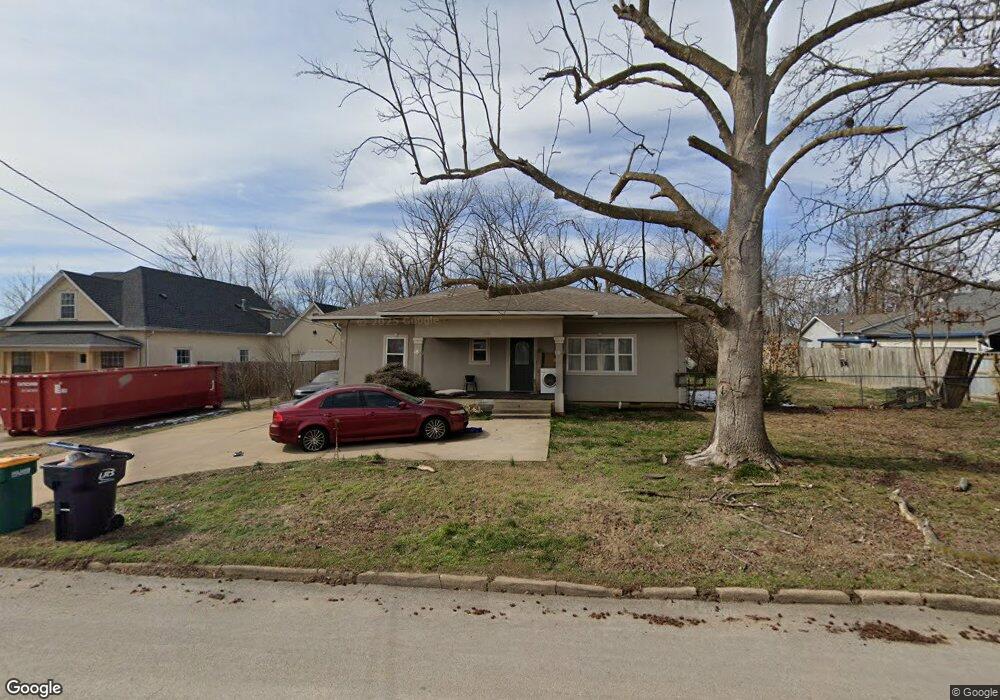
1110 S 3rd St Rogers, AR 72756
Estimated Value: $213,000 - $270,000
3
Beds
1
Bath
1,232
Sq Ft
$201/Sq Ft
Est. Value
About This Home
This home is located at 1110 S 3rd St, Rogers, AR 72756 and is currently estimated at $247,371, approximately $200 per square foot. 1110 S 3rd St is a home located in Benton County with nearby schools including Frank Tillery Elementary School, Lingle Middle School, and Rogers Heritage High School.
Ownership History
Date
Name
Owned For
Owner Type
Purchase Details
Closed on
Nov 11, 2005
Sold by
Palma Martin A
Bought by
Garay Michael
Current Estimated Value
Home Financials for this Owner
Home Financials are based on the most recent Mortgage that was taken out on this home.
Original Mortgage
$88,000
Outstanding Balance
$46,559
Interest Rate
5.87%
Mortgage Type
Adjustable Rate Mortgage/ARM
Estimated Equity
$200,812
Purchase Details
Closed on
Aug 31, 1998
Bought by
Palma
Purchase Details
Closed on
Dec 17, 1992
Bought by
Sinclair and Campbell
Purchase Details
Closed on
Mar 15, 1978
Bought by
Jones
Create a Home Valuation Report for This Property
The Home Valuation Report is an in-depth analysis detailing your home's value as well as a comparison with similar homes in the area
Home Values in the Area
Average Home Value in this Area
Purchase History
| Date | Buyer | Sale Price | Title Company |
|---|---|---|---|
| Garay Michael | $98,000 | Heritage Land Title Of Arkan | |
| Palma | $51,000 | -- | |
| Sinclair | $15,000 | -- | |
| Jones | $27,000 | -- |
Source: Public Records
Mortgage History
| Date | Status | Borrower | Loan Amount |
|---|---|---|---|
| Open | Garay Michael | $88,000 |
Source: Public Records
Tax History
| Year | Tax Paid | Tax Assessment Tax Assessment Total Assessment is a certain percentage of the fair market value that is determined by local assessors to be the total taxable value of land and additions on the property. | Land | Improvement |
|---|---|---|---|---|
| 2025 | $1,288 | $42,069 | $19,000 | $23,069 |
| 2024 | $1,152 | $42,069 | $19,000 | $23,069 |
| 2023 | $1,047 | $27,070 | $8,000 | $19,070 |
| 2022 | $1,005 | $27,070 | $8,000 | $19,070 |
| 2021 | $919 | $27,070 | $8,000 | $19,070 |
| 2020 | $836 | $15,230 | $3,200 | $12,030 |
| 2019 | $836 | $15,230 | $3,200 | $12,030 |
| 2018 | $836 | $15,230 | $3,200 | $12,030 |
| 2017 | $790 | $15,230 | $3,200 | $12,030 |
| 2016 | $790 | $15,230 | $3,200 | $12,030 |
| 2015 | $969 | $18,310 | $3,400 | $14,910 |
| 2014 | $969 | $18,310 | $3,400 | $14,910 |
Source: Public Records
Map
Nearby Homes
- 401 W Mulberry St
- 217 W Birch St
- 1203 S 3rd St
- 1013 S 1st St
- Lot 7 S 3rd St
- Lot 5 S 3rd St
- Lot 6 S 3rd St
- 803 S 1st St
- 1511 S 5th St Unit 2
- 1023 S B St
- 707 S 7th St
- 525 S 6th St
- 501 S 7th St
- 906 W Holly St
- 630 W Poplar St
- 1014 S E St
- 1013 S E St
- 201 E Walnut St
- 1020 W Cypress St Unit 3
- 1020 W Cypress St
Your Personal Tour Guide
Ask me questions while you tour the home.