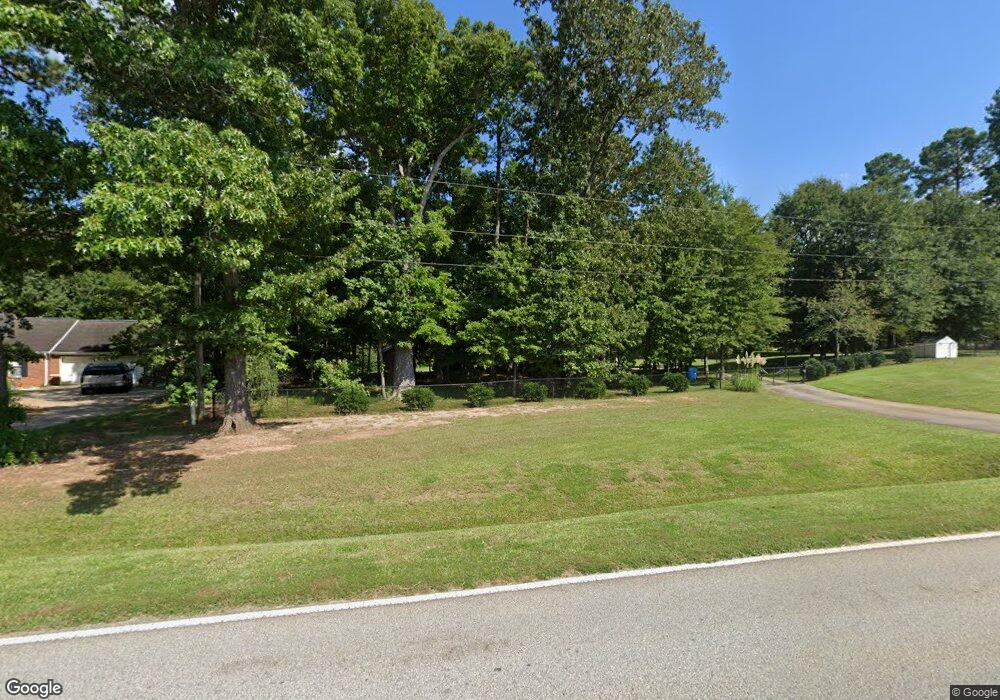
1110 S Bethany Rd Locust Grove, GA 30248
Estimated Value: $284,000 - $314,000
3
Beds
2
Baths
1,384
Sq Ft
$216/Sq Ft
Est. Value
About This Home
This home is located at 1110 S Bethany Rd, Locust Grove, GA 30248 and is currently estimated at $298,264, approximately $215 per square foot. 1110 S Bethany Rd is a home located in Henry County with nearby schools including Unity Grove Elementary School, Locust Grove Middle School, and Locust Grove High School.
Ownership History
Date
Name
Owned For
Owner Type
Purchase Details
Closed on
Dec 14, 2021
Sold by
Reker Scott
Bought by
Reker Scott David and Reker Pamela
Current Estimated Value
Home Financials for this Owner
Home Financials are based on the most recent Mortgage that was taken out on this home.
Original Mortgage
$216,000
Outstanding Balance
$167,930
Interest Rate
2.39%
Mortgage Type
New Conventional
Estimated Equity
$130,334
Purchase Details
Closed on
Aug 13, 1999
Sold by
Precision Builders Inc
Bought by
Baker Scott
Home Financials for this Owner
Home Financials are based on the most recent Mortgage that was taken out on this home.
Original Mortgage
$90,303
Interest Rate
7.73%
Mortgage Type
FHA
Create a Home Valuation Report for This Property
The Home Valuation Report is an in-depth analysis detailing your home's value as well as a comparison with similar homes in the area
Home Values in the Area
Average Home Value in this Area
Purchase History
| Date | Buyer | Sale Price | Title Company |
|---|---|---|---|
| Reker Scott David | -- | -- | |
| Baker Scott | $91,500 | -- |
Source: Public Records
Mortgage History
| Date | Status | Borrower | Loan Amount |
|---|---|---|---|
| Open | Reker Scott David | $216,000 | |
| Previous Owner | Baker Scott | $90,303 |
Source: Public Records
Tax History Compared to Growth
Tax History
| Year | Tax Paid | Tax Assessment Tax Assessment Total Assessment is a certain percentage of the fair market value that is determined by local assessors to be the total taxable value of land and additions on the property. | Land | Improvement |
|---|---|---|---|---|
| 2025 | $5,309 | $133,280 | $15,640 | $117,640 |
| 2024 | $5,309 | $114,080 | $14,120 | $99,960 |
| 2023 | $4,178 | $107,880 | $13,600 | $94,280 |
| 2022 | $3,713 | $95,760 | $12,560 | $83,200 |
| 2021 | $2,356 | $74,160 | $10,760 | $63,400 |
| 2020 | $2,096 | $64,120 | $10,160 | $53,960 |
| 2019 | $1,957 | $58,720 | $9,640 | $49,080 |
| 2018 | $1,873 | $55,280 | $8,880 | $46,400 |
| 2016 | $1,268 | $39,080 | $6,960 | $32,120 |
| 2015 | $1,103 | $34,160 | $7,040 | $27,120 |
| 2014 | $949 | $30,080 | $7,040 | $23,040 |
Source: Public Records
Map
Nearby Homes
- 104 Waratah Dr
- 75 Price Dr W
- 825 S Bethany Rd
- 943 Colvin Dr
- 678 Seabolt Rd
- 560 Coan Dr
- 390 Coan Dr
- 1579 S Bethany Rd
- 705 Seabolt Rd
- 340 Colvin Dr
- 735 Strawflower Ln
- 435 Rabbit Run
- 1000 Coan Dr
- 201 Nina Cir
- 604 Onieda Dr
- 3305 Hancock Point
- 551 Rosalind Terrace
- 328 Trulove Ln Unit 32
- 316 Trulove Ln Unit 35
- 521 Deadwood Trail
- 1120 S Bethany Rd
- 0 Harris Dr Unit 20019120
- 0 Harris Dr Unit 8486089
- 0 Harris Dr Unit 8283744
- 0 Harris Dr Unit 8155007
- 0 Harris Dr Unit 8075575
- 0 Harris Dr Unit 8619553
- 0 Harris Dr Unit 8602357
- 0 Harris Dr Unit 8505702
- 0 Harris Dr Unit 8988752
- 0 Harris Dr Unit 9006362
- 0 Harris Dr Unit 8979582
- 0 Harris Dr Unit 8859835
- 642 Harris Dr
- 1150 S Bethany Rd
- 647 Harris Dr
- 638 Harris Dr
- 617 Harris Dr
- 1050 S Bethany Rd
- 588 Harris Dr