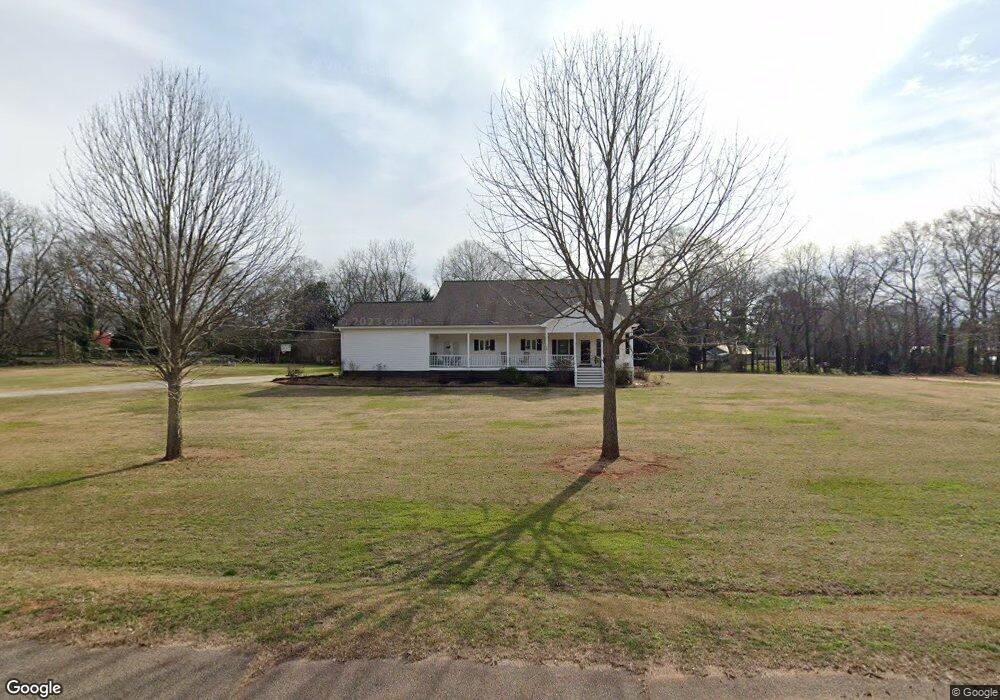
1110 Second St Bishop, GA 30621
Estimated Value: $306,000 - $431,000
3
Beds
2
Baths
2,012
Sq Ft
$174/Sq Ft
Est. Value
About This Home
This home is located at 1110 Second St, Bishop, GA 30621 and is currently estimated at $350,614, approximately $174 per square foot. 1110 Second St is a home with nearby schools including Morgan County Primary School, Morgan County Elementary School, and Morgan County Middle School.
Ownership History
Date
Name
Owned For
Owner Type
Purchase Details
Closed on
Feb 25, 2010
Sold by
Federal National Mortgage Association
Bought by
Harper John David and Harper Jennifer A
Current Estimated Value
Home Financials for this Owner
Home Financials are based on the most recent Mortgage that was taken out on this home.
Original Mortgage
$164,957
Outstanding Balance
$107,980
Interest Rate
4.97%
Mortgage Type
FHA
Estimated Equity
$242,634
Purchase Details
Closed on
Nov 3, 2009
Sold by
Bearden Todd D
Bought by
Citimortgage Inc
Purchase Details
Closed on
May 26, 2006
Sold by
Bearden John W
Bought by
Bearden Todd Damon
Home Financials for this Owner
Home Financials are based on the most recent Mortgage that was taken out on this home.
Original Mortgage
$35,844
Interest Rate
6.5%
Mortgage Type
New Conventional
Create a Home Valuation Report for This Property
The Home Valuation Report is an in-depth analysis detailing your home's value as well as a comparison with similar homes in the area
Home Values in the Area
Average Home Value in this Area
Purchase History
| Date | Buyer | Sale Price | Title Company |
|---|---|---|---|
| Harper John David | $168,000 | -- | |
| Citimortgage Inc | $196,000 | -- | |
| Federal National Mortgage Association | -- | -- | |
| Citimortgage Inc | $195,958 | -- | |
| Bearden Todd Damon | $36,000 | -- |
Source: Public Records
Mortgage History
| Date | Status | Borrower | Loan Amount |
|---|---|---|---|
| Open | Harper John David | $164,957 | |
| Previous Owner | Bearden Todd Damon | $35,844 |
Source: Public Records
Tax History
| Year | Tax Paid | Tax Assessment Tax Assessment Total Assessment is a certain percentage of the fair market value that is determined by local assessors to be the total taxable value of land and additions on the property. | Land | Improvement |
|---|---|---|---|---|
| 2025 | $2,233 | $105,340 | $14,400 | $90,940 |
| 2024 | $2,270 | $97,674 | $14,400 | $83,274 |
| 2023 | $2,132 | $89,029 | $14,400 | $74,629 |
| 2022 | $1,950 | $81,704 | $11,200 | $70,504 |
| 2021 | $1,879 | $78,504 | $8,000 | $70,504 |
| 2020 | $1,896 | $78,504 | $8,000 | $70,504 |
| 2019 | $1,703 | $69,602 | $8,000 | $61,602 |
| 2018 | $1,552 | $62,714 | $4,000 | $58,714 |
| 2017 | $1,718 | $63,396 | $4,000 | $59,396 |
| 2016 | $1,682 | $65,570 | $4,000 | $61,570 |
| 2015 | $1,732 | $66,640 | $4,000 | $62,640 |
| 2014 | $1,205 | $48,240 | $3,800 | $44,440 |
| 2013 | -- | $51,160 | $4,000 | $47,160 |
Source: Public Records
Map
Nearby Homes
- 4660 Fairplay Rd
- 5921 Bostwick Rd
- 0 Peppers Rd Unit 10696514
- 0 Peppers Rd Unit CL350834
- 1 Peppers Rd
- 1501 Launius Rd
- LOT 24 Apalachee Rd
- 1081 Rehoboth Rd
- LOT 3 Mallory Rd
- 4441 Highway 83
- 3386 Chandler Rd
- 3380 Fairplay Rd
- 1700 Beaver Dam Rd
- 3315 Chandler Rd
- LOT 14 Wallace Rd
- LOT 8 Wallace Rd
- 1260 Jones Wood Ln
- 4318 Hester Town Rd
- 2644 Nunnally Shoals Tract 2 Rd
- 28 Tomahawk Trail
- 4810 Fairplay Rd
- 4760 Fairplay Rd
- 1140 Second St
- 1131 2nd St
- 1141 Second St
- 1101 Second St
- 4830 Fairplay Rd
- 4830 Fairplay Rd
- 4750 Fairplay Rd
- 4748 Fairplay Rd
- 4830 Fairplay Rd
- 1041 Second St
- 1031 Nunn Ln
- 1041 2nd St
- 4831 Fairplay Rd
- 1030 Second St
- 4710 Fairplay Rd
- 1031 Second St
- 4841 Fairplay Rd
- 4850 Fairplay Rd
Your Personal Tour Guide
Ask me questions while you tour the home.