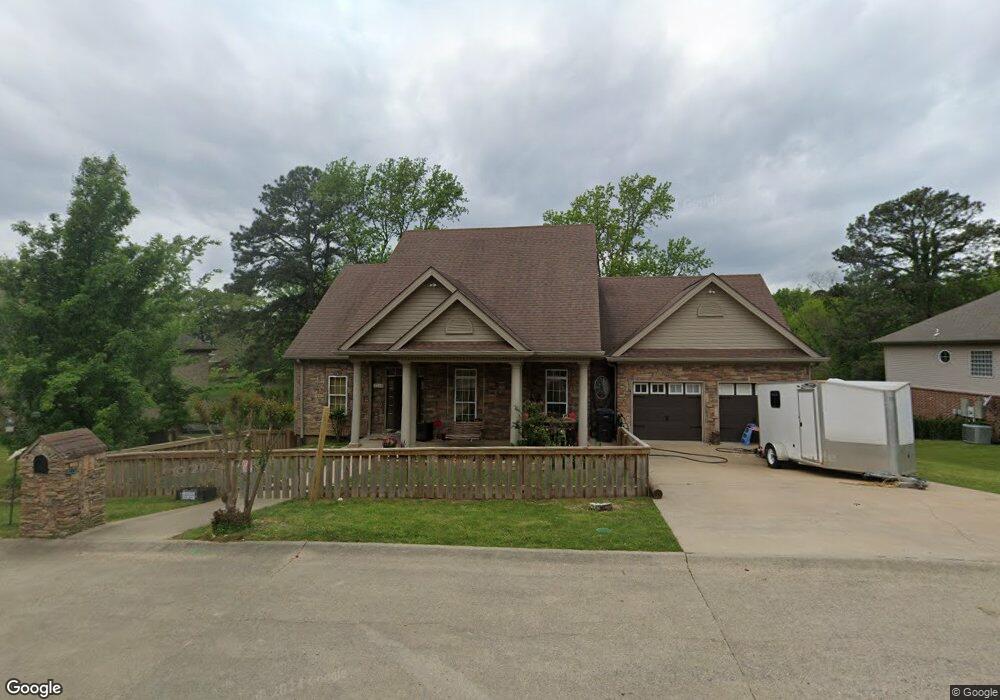
1110 Shangri la Cove Benton, AR 72015
Estimated Value: $295,000 - $368,000
--
Bed
2
Baths
1,991
Sq Ft
$166/Sq Ft
Est. Value
About This Home
This home is located at 1110 Shangri la Cove, Benton, AR 72015 and is currently estimated at $330,333, approximately $165 per square foot. 1110 Shangri la Cove is a home located in Saline County with nearby schools including Perrin Elementary School, Benton Middle School, and Benton Junior High School.
Ownership History
Date
Name
Owned For
Owner Type
Purchase Details
Closed on
Oct 16, 2023
Sold by
Finney Roger W and Finney Michelle D
Bought by
Roger And Michelle Finney Living Trust and Finney
Current Estimated Value
Purchase Details
Closed on
Jun 29, 2007
Sold by
Finney Roger W and Finney Michelle D Fitzpatrick
Bought by
Finney Roger W and Finney Michelle D
Home Financials for this Owner
Home Financials are based on the most recent Mortgage that was taken out on this home.
Original Mortgage
$280,000
Interest Rate
6.37%
Mortgage Type
New Conventional
Purchase Details
Closed on
Aug 30, 2006
Sold by
Ward Ferman and Ward Ernestine
Bought by
Fitzpatrick Michelle D
Home Financials for this Owner
Home Financials are based on the most recent Mortgage that was taken out on this home.
Original Mortgage
$23,700
Interest Rate
6.34%
Mortgage Type
Credit Line Revolving
Purchase Details
Closed on
Oct 16, 2003
Bought by
Ward
Purchase Details
Closed on
Jul 30, 1993
Bought by
Ward
Create a Home Valuation Report for This Property
The Home Valuation Report is an in-depth analysis detailing your home's value as well as a comparison with similar homes in the area
Home Values in the Area
Average Home Value in this Area
Purchase History
| Date | Buyer | Sale Price | Title Company |
|---|---|---|---|
| Roger And Michelle Finney Living Trust | -- | None Listed On Document | |
| Finney Roger W | -- | -- | |
| Finney Roger W | -- | -- | |
| Fitzpatrick Michelle D | $237,000 | -- | |
| Ward | -- | -- | |
| Ward | -- | -- |
Source: Public Records
Mortgage History
| Date | Status | Borrower | Loan Amount |
|---|---|---|---|
| Previous Owner | Finney Roger W | $280,000 | |
| Previous Owner | Fitzpatrick Michelle D | $23,700 |
Source: Public Records
Tax History Compared to Growth
Tax History
| Year | Tax Paid | Tax Assessment Tax Assessment Total Assessment is a certain percentage of the fair market value that is determined by local assessors to be the total taxable value of land and additions on the property. | Land | Improvement |
|---|---|---|---|---|
| 2025 | $2,896 | $62,131 | $8,320 | $53,811 |
| 2024 | $2,964 | $62,131 | $8,320 | $53,811 |
| 2023 | $2,706 | $62,131 | $8,320 | $53,811 |
| 2022 | $2,269 | $62,131 | $8,320 | $53,811 |
| 2021 | $2,143 | $45,460 | $6,400 | $39,060 |
| 2020 | $2,143 | $45,460 | $6,400 | $39,060 |
| 2019 | $2,143 | $45,460 | $6,400 | $39,060 |
| 2018 | $2,164 | $45,460 | $6,400 | $39,060 |
| 2017 | $2,164 | $45,460 | $6,400 | $39,060 |
| 2016 | $2,542 | $44,830 | $6,400 | $38,430 |
| 2015 | $2,515 | $44,830 | $6,400 | $38,430 |
| 2014 | $2,165 | $44,830 | $6,400 | $38,430 |
Source: Public Records
Map
Nearby Homes
- 1112 Griffey
- 1108 Watson Place
- 707 Sunset
- 2106 Penland
- 1220 Crystal
- 815 Desoto Place
- 2003 Lynnwood
- 715 Rosewood Dr
- 2002 Lynnwood
- 1912 Cedarhurst
- 1201 Jameson Ave
- 1212 Chris Dr
- 721 Edgehill Dr
- 2404 Shaker Ridge
- 1910 Harmon Dr
- 1923 Sagecrest St
- 1007 Montclair St
- 1925 W Lakeview
- 2014 W Lakeview
- 1022 E Sevier St
- 1118 Shangri la Cove
- 1102 Shangri la Cove
- 1018 Shangri la Cove
- 1700 Alcoa Rd
- 1202 Shangri la Cove
- 1201 Shangri la Cove
- 1607 Jameson Dr
- 1010 Shangri la Cove
- 1703 Jameson Dr
- 1013 Shangri la Cove
- 1605 Jameson Dr
- 0 Shangri la Cove
- 1022 Griffey
- 1004 Shangri la Cove
- 1705 Jameson Dr
- 1104 Griffey
- 1018 Griffey
- 1525 Jameson Dr
- 1108 Griffey
- 1005 Shangri la Cove