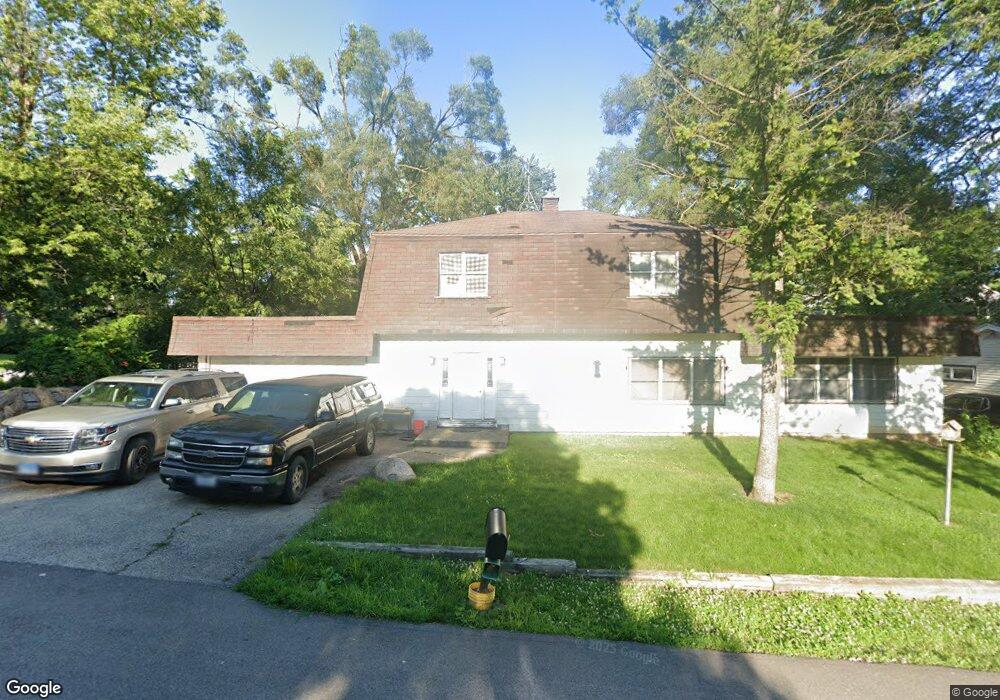
1110 Van Buren St Wauconda, IL 60084
Estimated Value: $373,023 - $475,000
4
Beds
2
Baths
2,430
Sq Ft
$171/Sq Ft
Est. Value
About This Home
This home is located at 1110 Van Buren St, Wauconda, IL 60084 and is currently estimated at $414,756, approximately $170 per square foot. 1110 Van Buren St is a home located in Lake County with nearby schools including Wauconda Grade School, Wauconda Middle School, and Wauconda High School.
Ownership History
Date
Name
Owned For
Owner Type
Purchase Details
Closed on
May 28, 1999
Sold by
Mcgrath Valerie G
Bought by
Schachelmeyer Eric W
Current Estimated Value
Home Financials for this Owner
Home Financials are based on the most recent Mortgage that was taken out on this home.
Original Mortgage
$154,850
Outstanding Balance
$41,176
Interest Rate
7.15%
Estimated Equity
$373,580
Purchase Details
Closed on
Aug 29, 1995
Sold by
Mcgrath Ellyn S
Bought by
Mcgrath Edward H and Mcgrath Valerie G
Home Financials for this Owner
Home Financials are based on the most recent Mortgage that was taken out on this home.
Original Mortgage
$96,000
Interest Rate
9.35%
Purchase Details
Closed on
Aug 28, 1995
Sold by
Shaw James M
Bought by
Mcgrath Edward H and Mcgrath Valerie G
Home Financials for this Owner
Home Financials are based on the most recent Mortgage that was taken out on this home.
Original Mortgage
$96,000
Interest Rate
9.35%
Create a Home Valuation Report for This Property
The Home Valuation Report is an in-depth analysis detailing your home's value as well as a comparison with similar homes in the area
Home Values in the Area
Average Home Value in this Area
Purchase History
| Date | Buyer | Sale Price | Title Company |
|---|---|---|---|
| Schachelmeyer Eric W | $163,000 | Chicago Title Insurance Co | |
| Mcgrath Edward H | -- | -- | |
| Mcgrath Edward H | -- | -- | |
| Mcgrath Edward H | -- | -- | |
| Mcgrath Edward H | -- | -- | |
| Mcgrath Edward H | -- | -- |
Source: Public Records
Mortgage History
| Date | Status | Borrower | Loan Amount |
|---|---|---|---|
| Open | Schachelmeyer Eric W | $154,850 | |
| Previous Owner | Mcgrath Edward H | $96,000 |
Source: Public Records
Tax History Compared to Growth
Tax History
| Year | Tax Paid | Tax Assessment Tax Assessment Total Assessment is a certain percentage of the fair market value that is determined by local assessors to be the total taxable value of land and additions on the property. | Land | Improvement |
|---|---|---|---|---|
| 2024 | $7,395 | $91,089 | $17,831 | $73,258 |
| 2023 | $8,267 | $83,262 | $16,299 | $66,963 |
| 2022 | $8,267 | $81,763 | $19,905 | $61,858 |
| 2021 | $7,887 | $77,258 | $18,808 | $58,450 |
| 2020 | $7,632 | $73,635 | $17,926 | $55,709 |
| 2019 | $6,776 | $69,592 | $16,942 | $52,650 |
| 2018 | $6,006 | $58,250 | $20,090 | $38,160 |
| 2017 | $6,000 | $57,577 | $19,858 | $37,719 |
| 2016 | $5,624 | $54,524 | $18,805 | $35,719 |
| 2015 | $5,268 | $50,054 | $17,263 | $32,791 |
| 2014 | $6,331 | $54,589 | $19,335 | $35,254 |
| 2012 | $6,175 | $60,219 | $18,498 | $41,721 |
Source: Public Records
Map
Nearby Homes
- 0 Bonner Rd
- 1260 Water Stone Cir
- 701 Lake Shore Dr
- 28855 N Garland Rd
- 419 Hill St Unit 2805
- 28177 N Garland Rd
- 29564 N Garland Rd
- 26049 N Il Route 59
- 302 Stillwater Ct Unit 1702
- 309 Stillwater Ct Unit 1101
- 315 Hill St Unit A
- 325 Sundown Ct Unit B
- 310 Sundown Ct Unit E
- 26241 W Bonner Rd
- 136 Parkview Dr Unit 5136
- 225 Regency Ct Unit A
- 235 Regency Ct Unit B
- 240 Regency Ct
- 450 N Main St Unit S307A
- 450 N Main St Unit S208A
- 1108 Van Buren St
- 908 Pershing Dr
- 524 Pershing Dr
- 512 Pershing Dr
- 516 Pershing Dr
- 1106 Van Buren St
- 910 Pershing Dr
- 1109 Van Buren St
- 1111 Van Buren St
- 1107 Van Buren St
- 1113 Van Buren St
- 1113 Van Buren Ave
- 905 Sheridan Dr
- 907 Pershing Dr
- 1120 Van Buren St
- 827 Sheridan Dr
- 907 Sheridan Dr
- 1102 Van Buren St
- 914 Pershing Dr
- 909 Pershing Dr