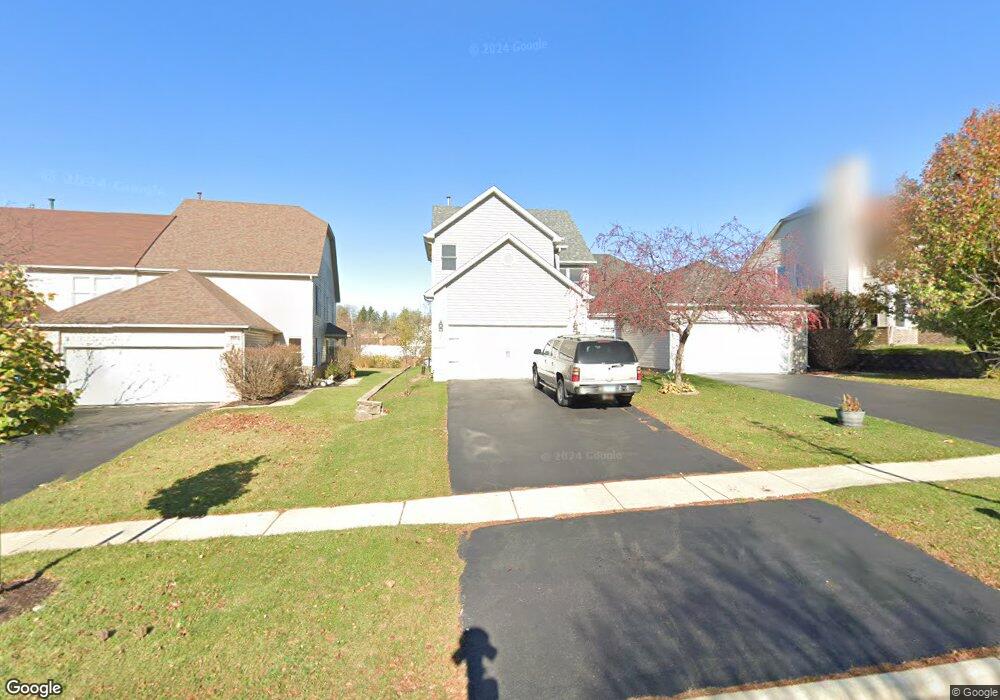
1110 Viewpoint Dr Lake In the Hills, IL 60156
Estimated Value: $338,000 - $344,000
4
Beds
3
Baths
1,771
Sq Ft
$192/Sq Ft
Est. Value
About This Home
This home is located at 1110 Viewpoint Dr, Lake In the Hills, IL 60156 and is currently estimated at $340,789, approximately $192 per square foot. 1110 Viewpoint Dr is a home located in McHenry County with nearby schools including Westfield Community School, Lake in the Hills Elementary School, and United Junior High School.
Ownership History
Date
Name
Owned For
Owner Type
Purchase Details
Closed on
Aug 28, 2009
Sold by
Reed Corine J
Bought by
Snyder Matthew F and Snyder Brittany L
Current Estimated Value
Home Financials for this Owner
Home Financials are based on the most recent Mortgage that was taken out on this home.
Original Mortgage
$151,760
Outstanding Balance
$100,204
Interest Rate
5.38%
Mortgage Type
FHA
Estimated Equity
$240,585
Purchase Details
Closed on
Oct 6, 1999
Sold by
Davis Linda T and Kious Linda T
Bought by
Reed Corine J
Home Financials for this Owner
Home Financials are based on the most recent Mortgage that was taken out on this home.
Original Mortgage
$108,500
Interest Rate
10%
Purchase Details
Closed on
Jul 21, 1995
Sold by
Allied Building Corp
Bought by
Davis Linda T
Home Financials for this Owner
Home Financials are based on the most recent Mortgage that was taken out on this home.
Original Mortgage
$120,400
Interest Rate
7.5%
Create a Home Valuation Report for This Property
The Home Valuation Report is an in-depth analysis detailing your home's value as well as a comparison with similar homes in the area
Home Values in the Area
Average Home Value in this Area
Purchase History
| Date | Buyer | Sale Price | Title Company |
|---|---|---|---|
| Snyder Matthew F | $157,000 | Executive Title Inc | |
| Reed Corine J | $155,000 | First American | |
| Davis Linda T | $142,500 | First American Title |
Source: Public Records
Mortgage History
| Date | Status | Borrower | Loan Amount |
|---|---|---|---|
| Open | Snyder Matthew F | $151,760 | |
| Previous Owner | Reed Corine J | $108,500 | |
| Previous Owner | Davis Linda T | $120,400 |
Source: Public Records
Tax History Compared to Growth
Tax History
| Year | Tax Paid | Tax Assessment Tax Assessment Total Assessment is a certain percentage of the fair market value that is determined by local assessors to be the total taxable value of land and additions on the property. | Land | Improvement |
|---|---|---|---|---|
| 2024 | $7,183 | $97,774 | $20,043 | $77,731 |
| 2023 | $6,824 | $87,447 | $17,926 | $69,521 |
| 2022 | $6,788 | $82,665 | $16,179 | $66,486 |
| 2021 | $6,522 | $77,013 | $15,073 | $61,940 |
| 2020 | $6,358 | $74,286 | $14,539 | $59,747 |
| 2019 | $6,226 | $71,101 | $13,916 | $57,185 |
| 2018 | $6,194 | $68,116 | $12,855 | $55,261 |
| 2017 | $6,066 | $64,169 | $12,110 | $52,059 |
| 2016 | $5,968 | $60,185 | $11,358 | $48,827 |
| 2013 | -- | $58,133 | $10,596 | $47,537 |
Source: Public Records
Map
Nearby Homes
- 937 Mesa Dr
- 900 Windstone Ct
- 809 Menominee Dr
- 807 Menominee Dr
- 7 Michael Ct
- 992 Mcphee Dr
- 909 Roger St
- LOT 3 Blackhawk Dr
- 16 Brian Ct
- 1049 Horizon Ridge
- 266 Grandview Ct
- 70 Hilltop Dr Unit 4
- 1431 Essex St
- Lots 10 & 11 Ramble Rd
- 1019 Maple St
- 135 Arquilla Dr
- 721 Brentwood Ct
- 1345 Cunat Ct Unit 1B
- 1345 Cunat Ct Unit 2D
- 1235 Fairmont Ct
- 1112 Viewpoint Dr
- 1114 Viewpoint Dr
- 1106 Viewpoint Dr
- 14 Gail Ct
- 1104 Viewpoint Dr
- 1116 Viewpoint Dr
- 1102 Viewpoint Dr
- 12 Gail Ct
- 1118 Viewpoint Dr
- 16 Gail Ct
- 1100 Viewpoint Dr
- 1120 Viewpoint Dr
- 1098 Viewpoint Dr
- 1089 Viewpoint Dr
- 1087 Viewpoint Dr
- 1091 Viewpoint Dr
- 10 Gail Ct
- 1122 Viewpoint Dr
- 1093 Viewpoint Dr
- 1096 Viewpoint Dr