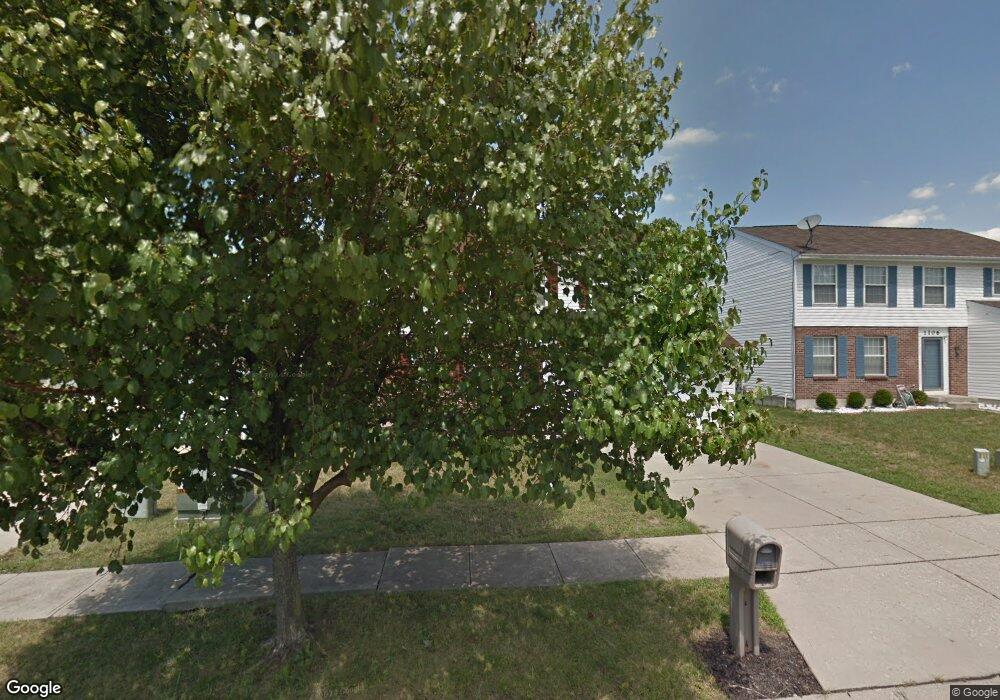
1110 Virescent Ct Cincinnati, OH 45224
College Hill NeighborhoodEstimated Value: $200,000 - $316,000
4
Beds
2
Baths
2,130
Sq Ft
$124/Sq Ft
Est. Value
About This Home
This home is located at 1110 Virescent Ct, Cincinnati, OH 45224 and is currently estimated at $264,375, approximately $124 per square foot. 1110 Virescent Ct is a home located in Hamilton County with nearby schools including Pleasant Hill Elementary School, Shroder High School, and Western Hills High School.
Ownership History
Date
Name
Owned For
Owner Type
Purchase Details
Closed on
Jul 12, 2016
Sold by
Ah4r 1 Oh Llc
Bought by
Ah4r 1 Properties Llc
Current Estimated Value
Purchase Details
Closed on
Feb 25, 2013
Sold by
Blackley Andre
Bought by
Ah4r I Oh Llc
Purchase Details
Closed on
Jun 30, 2004
Sold by
Johnson Aaron M and Johnson Nichole J
Bought by
Blackley Andre and Poole Blackley Holly
Home Financials for this Owner
Home Financials are based on the most recent Mortgage that was taken out on this home.
Original Mortgage
$145,500
Interest Rate
6.37%
Mortgage Type
Unknown
Purchase Details
Closed on
Dec 10, 2002
Sold by
Taylor Kenneth L and Taylor Marla M
Bought by
Johnson Aaron M and Johnson Nichole J
Home Financials for this Owner
Home Financials are based on the most recent Mortgage that was taken out on this home.
Original Mortgage
$134,883
Interest Rate
6%
Mortgage Type
FHA
Purchase Details
Closed on
Jun 11, 1998
Sold by
American Heritage Construction & Develop
Bought by
Taylor Kenneth L and Taylor Marla M
Home Financials for this Owner
Home Financials are based on the most recent Mortgage that was taken out on this home.
Original Mortgage
$121,217
Interest Rate
7.22%
Mortgage Type
FHA
Create a Home Valuation Report for This Property
The Home Valuation Report is an in-depth analysis detailing your home's value as well as a comparison with similar homes in the area
Home Values in the Area
Average Home Value in this Area
Purchase History
| Date | Buyer | Sale Price | Title Company |
|---|---|---|---|
| Ah4r 1 Properties Llc | -- | -- | |
| Ah4r I Oh Llc | $85,100 | Attorney | |
| Blackley Andre | $150,000 | Advanced Land Title Agency L | |
| Johnson Aaron M | $137,000 | -- | |
| Taylor Kenneth L | $126,500 | -- |
Source: Public Records
Mortgage History
| Date | Status | Borrower | Loan Amount |
|---|---|---|---|
| Previous Owner | Blackley Andre | $145,500 | |
| Previous Owner | Johnson Aaron M | $134,883 | |
| Previous Owner | Taylor Kenneth L | $121,217 |
Source: Public Records
Tax History Compared to Growth
Tax History
| Year | Tax Paid | Tax Assessment Tax Assessment Total Assessment is a certain percentage of the fair market value that is determined by local assessors to be the total taxable value of land and additions on the property. | Land | Improvement |
|---|---|---|---|---|
| 2024 | $4,370 | $68,565 | $12,040 | $56,525 |
| 2023 | $4,378 | $68,565 | $12,040 | $56,525 |
| 2022 | $3,409 | $47,912 | $9,776 | $38,136 |
| 2021 | $3,344 | $47,912 | $9,776 | $38,136 |
| 2020 | $3,354 | $47,912 | $9,776 | $38,136 |
| 2019 | $3,232 | $42,028 | $8,575 | $33,453 |
| 2018 | $3,217 | $42,028 | $8,575 | $33,453 |
| 2017 | $3,098 | $42,028 | $8,575 | $33,453 |
| 2016 | $3,316 | $43,880 | $9,167 | $34,713 |
| 2015 | $2,964 | $43,880 | $9,167 | $34,713 |
| 2014 | $2,980 | $43,880 | $9,167 | $34,713 |
| 2013 | $3,124 | $45,238 | $9,450 | $35,788 |
Source: Public Records
Map
Nearby Homes
- 5974 Sunridge Dr
- 6090 Scarlet Dr
- 6057 Capri Dr
- 6029 Waldway Ln
- 5839 Argus Rd
- 1127 Cedar Ave
- 6014 Argus Rd
- 1090 Elda Ln
- 5643 Red Cedar Dr
- 1147 Homeside Ave
- 1137 Homeside Ave
- 5687 Folchi Dr
- 5679 Folchi Dr
- 6421 Ridgefield Dr
- 6708 Sandalwood Ln
- 6123 Faircrest Ct
- 1063 Roxie Ln
- 5773 Lantana Ave
- 5923 Lantana Ave
- 1417 Cedar Ave
- 1106 Virescent Ct
- 1114 Virescent Ct
- 1120 Virescent Ct
- 1102 Virescent Ct
- 1113 Virescent Ct
- 1124 Virescent Ct
- 891 Venetian Terrace
- 1105 Virescent Ct
- 1109 Virescent Ct
- 1119 Virescent Ct
- 895 Venetian Terrace
- 1128 Virescent Ct
- 1127 Virescent Ct
- 875 Venetian Terrace
- 899 Venetian Terrace
- 1123 Virescent Ct
- 871 Venetian Terrace
- 878 Venetian Terrace
- 870 Venetian Terrace
- 888 Venetian Terrace