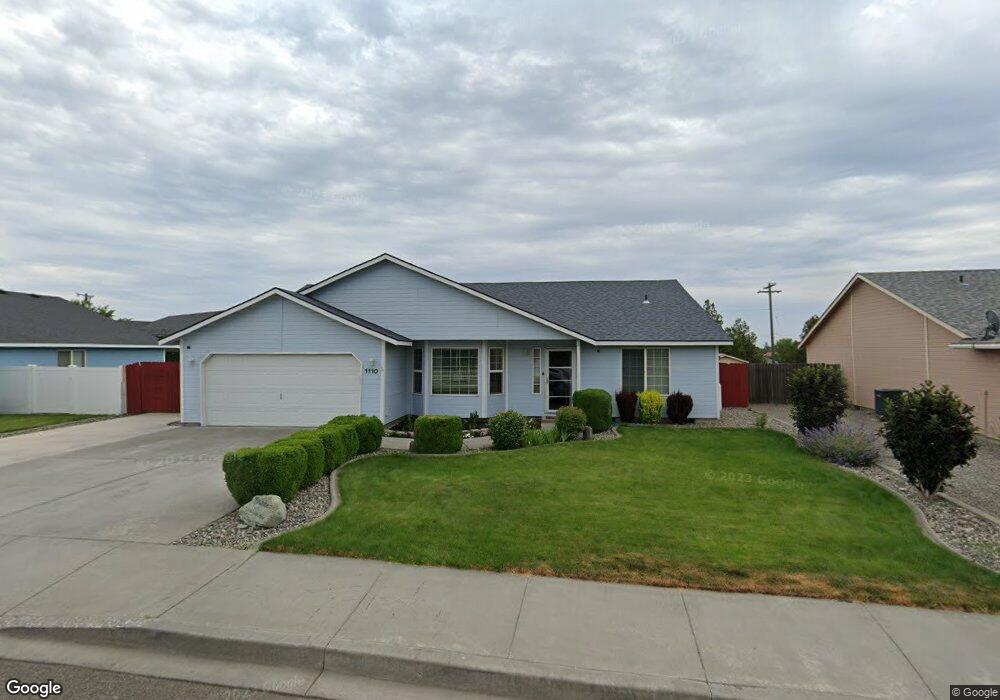
1110 W 37th Place Kennewick, WA 99337
Estimated Value: $433,298 - $491,000
4
Beds
2
Baths
1,856
Sq Ft
$249/Sq Ft
Est. Value
About This Home
This home is located at 1110 W 37th Place, Kennewick, WA 99337 and is currently estimated at $462,825, approximately $249 per square foot. 1110 W 37th Place is a home located in Benton County with nearby schools including Cascade Elementary School, Horse Heaven Hills Middle School, and Kennewick High School.
Ownership History
Date
Name
Owned For
Owner Type
Purchase Details
Closed on
Sep 8, 2011
Sold by
Knox Allan B
Bought by
Call Kristine K
Current Estimated Value
Home Financials for this Owner
Home Financials are based on the most recent Mortgage that was taken out on this home.
Original Mortgage
$149,300
Outstanding Balance
$103,308
Interest Rate
4.48%
Mortgage Type
New Conventional
Estimated Equity
$359,517
Purchase Details
Closed on
Aug 20, 2007
Sold by
Sarria Teresa A and Sarria Scott G
Bought by
Call Kristine K and Knox Allan
Home Financials for this Owner
Home Financials are based on the most recent Mortgage that was taken out on this home.
Original Mortgage
$146,000
Interest Rate
6.73%
Mortgage Type
Purchase Money Mortgage
Purchase Details
Closed on
Dec 16, 2005
Sold by
Sarria Scott G
Bought by
Sarria Teresa A
Home Financials for this Owner
Home Financials are based on the most recent Mortgage that was taken out on this home.
Original Mortgage
$144,000
Interest Rate
9.15%
Mortgage Type
Balloon
Create a Home Valuation Report for This Property
The Home Valuation Report is an in-depth analysis detailing your home's value as well as a comparison with similar homes in the area
Home Values in the Area
Average Home Value in this Area
Purchase History
| Date | Buyer | Sale Price | Title Company |
|---|---|---|---|
| Call Kristine K | $72,403 | Chicago Title | |
| Call Kristine K | $182,500 | Chicago Title | |
| Sarria Teresa A | -- | Frontier Title & Esc |
Source: Public Records
Mortgage History
| Date | Status | Borrower | Loan Amount |
|---|---|---|---|
| Open | Call Kristine K | $149,300 | |
| Previous Owner | Call Kristine K | $146,000 | |
| Previous Owner | Sarria Teresa A | $144,000 |
Source: Public Records
Tax History Compared to Growth
Tax History
| Year | Tax Paid | Tax Assessment Tax Assessment Total Assessment is a certain percentage of the fair market value that is determined by local assessors to be the total taxable value of land and additions on the property. | Land | Improvement |
|---|---|---|---|---|
| 2024 | $2,855 | $400,330 | $70,000 | $330,330 |
| 2023 | $2,855 | $356,290 | $70,000 | $286,290 |
| 2022 | $2,684 | $290,220 | $70,000 | $220,220 |
| 2021 | $2,569 | $274,060 | $50,000 | $224,060 |
| 2020 | $2,546 | $254,290 | $50,000 | $204,290 |
| 2019 | $2,220 | $241,110 | $50,000 | $191,110 |
| 2018 | $2,543 | $214,750 | $50,000 | $164,750 |
| 2017 | $2,071 | $201,570 | $50,000 | $151,570 |
| 2016 | $2,543 | $179,030 | $34,000 | $145,030 |
| 2015 | $2,495 | $179,030 | $34,000 | $145,030 |
| 2014 | -- | $174,480 | $34,000 | $140,480 |
| 2013 | -- | $174,480 | $34,000 | $140,480 |
Source: Public Records
Map
Nearby Homes
- 4004 S Jean St
- 4105 S Olympia St
- 1519 W 33rd Place
- 4001 S Quincy St
- 4202 S Kent St
- 1716 W 40th Ave
- 3403 S Hartford St
- 900 W 44th Place
- 3206 S Rainier St
- 1810 W 32nd Ave
- 1503 W 46th Ave
- TBD S Sharron Ct
- 3004 S Rainier St
- 1614 W 27th Place
- 2902 S Rainier St
- 37129 S S Olympia St
- 4209 S Cascade St
- 4007 S Waverly St
- 1052 S Underwood Place
- 1030 S Underwood Place
- 1106 W 37th Place
- 1114 W 37th Place
- 3617 S Newport Place
- 1102 W 37th Place
- 1109 W 37th Place
- 5641 S Newport Place
- 5695 S Newport Place
- 5623 S Newport Place
- 5677 S Newport Place
- 5659 S Newport Place
- 5713 S Newport Place
- 1201 W 37th Place Unit Spacious & Convenien
- 1201 W 37th Place Unit Plenty of Room For Y
- 1201 W 37th Place
- 1105 W 37th Place
- 3613 S Newport Place
- 1034 W 37th Place
- 3610 S Newport Place
- 3702 S Jean Place
- 3705 S Newport St