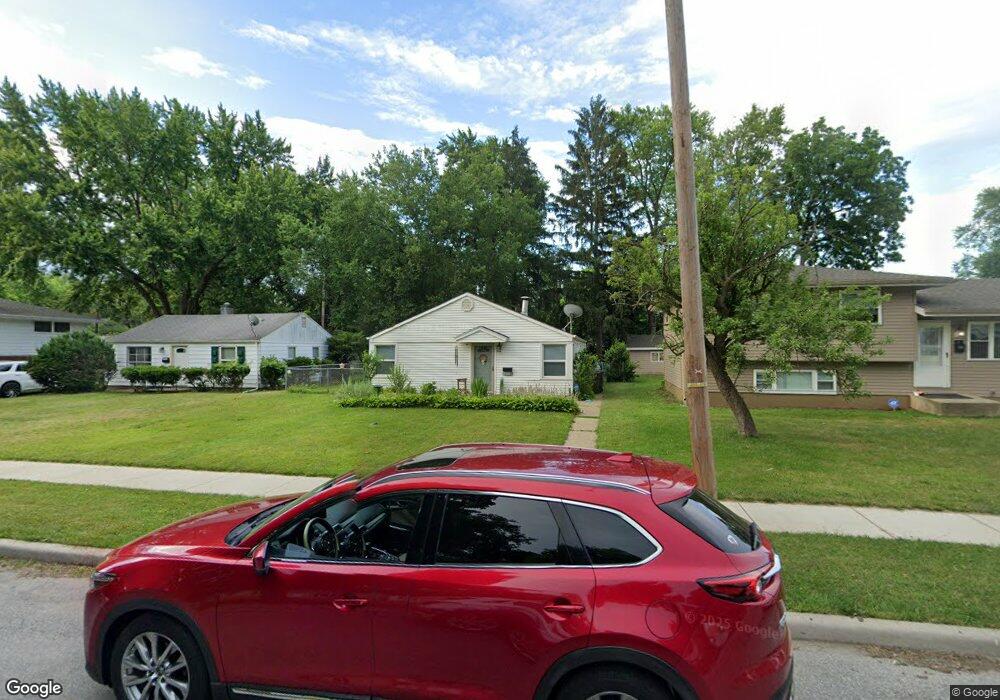
1110 W Rose St South Bend, IN 46616
Keller Park NeighborhoodEstimated Value: $110,000 - $130,000
3
Beds
1
Bath
1,008
Sq Ft
$122/Sq Ft
Est. Value
About This Home
This home is located at 1110 W Rose St, South Bend, IN 46616 and is currently estimated at $123,466, approximately $122 per square foot. 1110 W Rose St is a home located in St. Joseph County with nearby schools including Muessel Primary Center, Clay Intermediate Center, and Jefferson Intermediate Traditional School.
Ownership History
Date
Name
Owned For
Owner Type
Purchase Details
Closed on
Mar 6, 2024
Sold by
Walesiewicz Jonathan J
Bought by
Walesiewicz Jonathan J and Walesiewicz Lacey
Current Estimated Value
Home Financials for this Owner
Home Financials are based on the most recent Mortgage that was taken out on this home.
Original Mortgage
$102,564
Outstanding Balance
$100,579
Interest Rate
6.69%
Mortgage Type
FHA
Estimated Equity
$22,887
Purchase Details
Closed on
Feb 26, 2024
Sold by
Walesiewicz Jonathan J
Bought by
Walesiewicz Jonathan J and Walesiewicz Lacey
Home Financials for this Owner
Home Financials are based on the most recent Mortgage that was taken out on this home.
Original Mortgage
$102,564
Outstanding Balance
$100,579
Interest Rate
6.69%
Mortgage Type
FHA
Estimated Equity
$22,887
Purchase Details
Closed on
Sep 19, 2019
Sold by
Lavenberg Lorin E
Bought by
Marzette Antonio Allen
Create a Home Valuation Report for This Property
The Home Valuation Report is an in-depth analysis detailing your home's value as well as a comparison with similar homes in the area
Home Values in the Area
Average Home Value in this Area
Purchase History
| Date | Buyer | Sale Price | Title Company |
|---|---|---|---|
| Walesiewicz Jonathan J | -- | -- | |
| Walesiewicz Jonathan J | -- | -- | |
| Marzette Antonio Allen | -- | Fidelity National Title |
Source: Public Records
Mortgage History
| Date | Status | Borrower | Loan Amount |
|---|---|---|---|
| Open | Walesiewicz Jonathan J | $102,564 | |
| Closed | Walesiewicz Jonathan J | $102,564 |
Source: Public Records
Tax History Compared to Growth
Tax History
| Year | Tax Paid | Tax Assessment Tax Assessment Total Assessment is a certain percentage of the fair market value that is determined by local assessors to be the total taxable value of land and additions on the property. | Land | Improvement |
|---|---|---|---|---|
| 2024 | $1,058 | $85,800 | $8,800 | $77,000 |
| 2023 | $1,015 | $91,500 | $8,800 | $82,700 |
| 2022 | $856 | $78,200 | $8,800 | $69,400 |
| 2021 | $806 | $70,200 | $14,100 | $56,100 |
| 2020 | $523 | $47,600 | $9,500 | $38,100 |
| 2019 | $484 | $47,000 | $8,900 | $38,100 |
| 2018 | $478 | $45,400 | $8,200 | $37,200 |
| 2017 | $477 | $44,500 | $8,200 | $36,300 |
| 2016 | $484 | $44,500 | $8,200 | $36,300 |
| 2014 | $439 | $43,800 | $8,200 | $35,600 |
Source: Public Records
Map
Nearby Homes
- 1105 Queen St
- 1113 Beale St
- 1815 Sherman Ave
- 1029 W Bryan St
- 1308 Kinyon St
- 248 W Beale St
- 1428 Marigold Way Unit 111
- 1922 Berkley Place
- 1253 Diamond Ave
- 1958 Berkley Place
- 1201 Allen St
- 2106 Hollywood Place
- 1649 N Adams St
- 1645 N Adams St
- 1710 College St
- 1501 N Adams St
- 1602 College St
- 1116 Allen St
- 1738 N Brookfield St
- 1821 Marquette Blvd