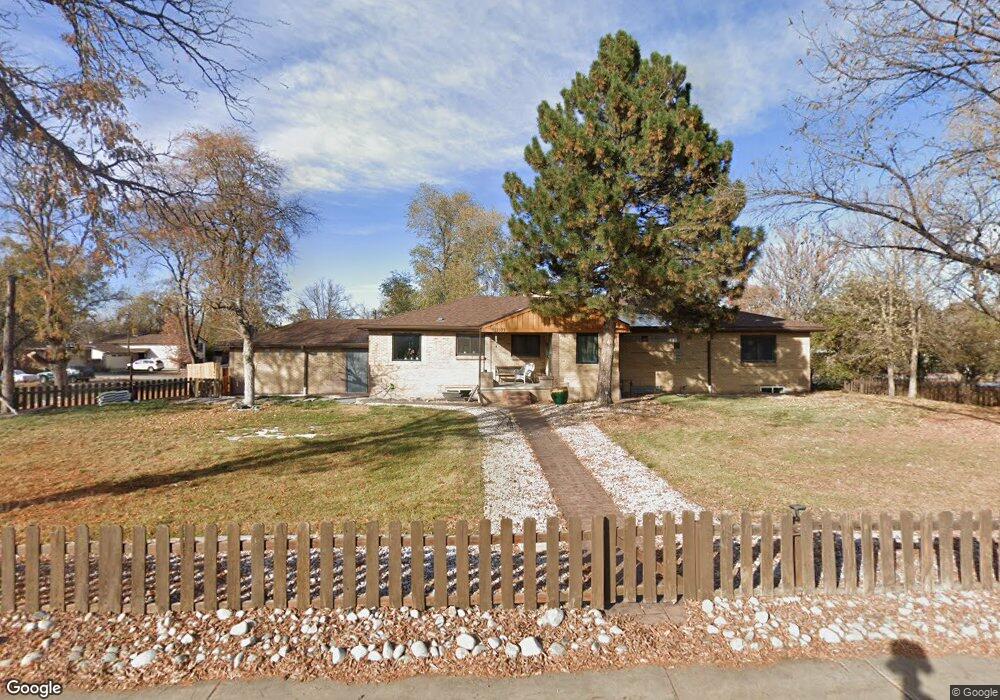
11101 Montview Blvd Unit Basement Aurora, CO 80010
North Aurora NeighborhoodEstimated Value: $514,000 - $743,109
3
Beds
2
Baths
1,972
Sq Ft
$299/Sq Ft
Est. Value
About This Home
This home is located at 11101 Montview Blvd Unit Basement, Aurora, CO 80010 and is currently estimated at $590,527, approximately $299 per square foot. 11101 Montview Blvd Unit Basement is a home located in Adams County with nearby schools including Montview Elementary School, North Middle School Health Sciences & Technology, and Aurora Central High School.
Ownership History
Date
Name
Owned For
Owner Type
Purchase Details
Closed on
Dec 4, 2015
Sold by
Morales Miguel A and Morales Yadira
Bought by
Saenz Jorge David Pineda
Current Estimated Value
Home Financials for this Owner
Home Financials are based on the most recent Mortgage that was taken out on this home.
Original Mortgage
$292,111
Outstanding Balance
$229,431
Interest Rate
3.99%
Mortgage Type
FHA
Estimated Equity
$361,096
Purchase Details
Closed on
Sep 27, 2013
Sold by
Mitchell James H
Bought by
Morales Miguel A and Morales Yadira
Home Financials for this Owner
Home Financials are based on the most recent Mortgage that was taken out on this home.
Original Mortgage
$166,250
Interest Rate
4.62%
Mortgage Type
New Conventional
Purchase Details
Closed on
Jun 15, 1993
Create a Home Valuation Report for This Property
The Home Valuation Report is an in-depth analysis detailing your home's value as well as a comparison with similar homes in the area
Home Values in the Area
Average Home Value in this Area
Purchase History
| Date | Buyer | Sale Price | Title Company |
|---|---|---|---|
| Saenz Jorge David Pineda | $297,500 | None Available | |
| Morales Miguel A | $175,000 | None Available | |
| -- | $108,000 | -- |
Source: Public Records
Mortgage History
| Date | Status | Borrower | Loan Amount |
|---|---|---|---|
| Open | Saenz Jorge David Pineda | $292,111 | |
| Previous Owner | Morales Miguel A | $166,250 |
Source: Public Records
Tax History
| Year | Tax Paid | Tax Assessment Tax Assessment Total Assessment is a certain percentage of the fair market value that is determined by local assessors to be the total taxable value of land and additions on the property. | Land | Improvement |
|---|---|---|---|---|
| 2025 | $4,668 | $44,610 | $5,440 | $39,170 |
| 2024 | $4,668 | $41,000 | $5,000 | $36,000 |
| 2023 | $4,742 | $48,240 | $5,210 | $43,030 |
| 2022 | $3,613 | $31,800 | $5,350 | $26,450 |
| 2021 | $3,765 | $31,800 | $5,350 | $26,450 |
| 2020 | $3,871 | $32,800 | $5,510 | $27,290 |
| 2019 | $3,864 | $32,800 | $5,510 | $27,290 |
| 2018 | $2,903 | $24,540 | $4,320 | $20,220 |
| 2017 | $2,579 | $24,540 | $4,320 | $20,220 |
| 2016 | $2,517 | $23,750 | $2,390 | $21,360 |
| 2015 | $2,438 | $23,750 | $2,390 | $21,360 |
| 2014 | -- | $18,610 | $2,390 | $16,220 |
Source: Public Records
Map
Nearby Homes
- 2045 Lima St
- 11087 Montview Blvd
- 2209 Macon St
- 1902 Kenton St
- 1732 Lansing St
- 1741 Joliet St
- 2025 Ironton St
- 2057 Ironton St
- 1945 Nome St
- 2241 Ironton St
- 1745 Jamaica St
- 2300 Ironton St
- 1764 Newark St
- 1657 Kingston St
- 2325 Ironton St
- 1680 Newark St
- 1781 N Oakland St
- 2522 Moline St
- 2381 Nome St
- 10495 E 22nd Ave
- 11101 Montview Blvd
- 11111 Montview Blvd
- 11111 E Montview Blvd
- 2030 Kingston St
- 1980 Kingston St
- 11087 E Montview Blvd
- 2025 Lansing St
- 2027 Kingston St
- 2040 Kingston St
- 2037 Kingston St
- 1985 Lansing St
- 2041 Lansing St
- 1970 Kingston St
- 2047 Kingston St
- 1995 Kingston St
- 11211 Montview Blvd
- 2050 Kingston St
- 1975 Lansing St
- 2057 Kingston St
- 1964 Kingston St
Your Personal Tour Guide
Ask me questions while you tour the home.