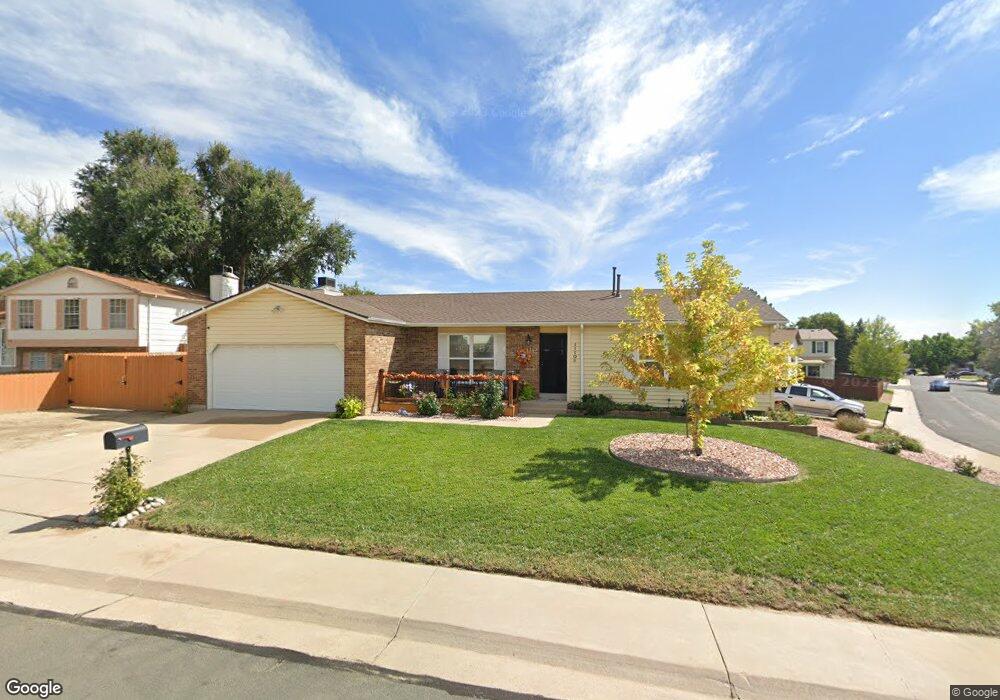
11108 Grape Ct Thornton, CO 80233
Grange Creek NeighborhoodEstimated Value: $436,000 - $460,000
2
Beds
1
Bath
1,307
Sq Ft
$340/Sq Ft
Est. Value
About This Home
This home is located at 11108 Grape Ct, Thornton, CO 80233 and is currently estimated at $444,201, approximately $339 per square foot. 11108 Grape Ct is a home located in Adams County with nearby schools including Riverdale Elementary School, Shadow Ridge Middle School, and Thornton High School.
Ownership History
Date
Name
Owned For
Owner Type
Purchase Details
Closed on
Jul 3, 2018
Sold by
Sampson Audrey J
Bought by
Montoya Sophia E
Current Estimated Value
Home Financials for this Owner
Home Financials are based on the most recent Mortgage that was taken out on this home.
Original Mortgage
$304,385
Outstanding Balance
$267,316
Interest Rate
5.12%
Mortgage Type
FHA
Estimated Equity
$176,885
Purchase Details
Closed on
Sep 29, 2008
Sold by
Dwyer Daniel Lee
Bought by
Sampson Audrey J
Home Financials for this Owner
Home Financials are based on the most recent Mortgage that was taken out on this home.
Original Mortgage
$127,991
Interest Rate
6.52%
Mortgage Type
FHA
Create a Home Valuation Report for This Property
The Home Valuation Report is an in-depth analysis detailing your home's value as well as a comparison with similar homes in the area
Home Values in the Area
Average Home Value in this Area
Purchase History
| Date | Buyer | Sale Price | Title Company |
|---|---|---|---|
| Montoya Sophia E | $310,000 | Homestead Title & Escrow | |
| Sampson Audrey J | $130,000 | Land Title Guarantee |
Source: Public Records
Mortgage History
| Date | Status | Borrower | Loan Amount |
|---|---|---|---|
| Open | Montoya Sophia E | $304,385 | |
| Previous Owner | Sampson Audrey J | $127,991 |
Source: Public Records
Tax History Compared to Growth
Tax History
| Year | Tax Paid | Tax Assessment Tax Assessment Total Assessment is a certain percentage of the fair market value that is determined by local assessors to be the total taxable value of land and additions on the property. | Land | Improvement |
|---|---|---|---|---|
| 2024 | $2,830 | $27,000 | $5,940 | $21,060 |
| 2023 | $2,801 | $31,050 | $6,090 | $24,960 |
| 2022 | $2,355 | $21,380 | $5,700 | $15,680 |
| 2021 | $2,433 | $21,380 | $5,700 | $15,680 |
| 2020 | $2,307 | $20,680 | $5,860 | $14,820 |
| 2019 | $2,312 | $20,680 | $5,860 | $14,820 |
| 2018 | $1,986 | $17,260 | $5,760 | $11,500 |
| 2017 | $1,806 | $17,260 | $5,760 | $11,500 |
| 2016 | $1,452 | $13,510 | $3,260 | $10,250 |
| 2015 | $1,450 | $13,510 | $3,260 | $10,250 |
| 2014 | $1,258 | $11,400 | $2,550 | $8,850 |
Source: Public Records
Map
Nearby Homes
- 11293 Holly St
- 11279 Holly St
- 11062 Fairfax Cir
- 5056 E 112th Ct
- 5055 E 112th Ct
- 10985 Glencoe Place
- 11343 Grape Cir
- 10979 Grange Creek Dr
- 11068 Eudora Cir
- 4807 E 110th Place
- 4911 E 112th Place
- 11354 Jersey St
- 5452 E 108th Place
- 10895 Fairfax Way
- 11306 Newport St
- 11135 Clermont Dr
- 4520 E 112th Place
- 4346 E 113th Place
- 11841 Elm Dr
- 11918 Glencoe Dr
- 5447 E 111th Dr
- 11118 Grape Ct
- 11107 Grape Ct
- 5428 E 111th Dr
- 11129 Harris Way
- 11139 Harris Way
- 11119 Harris Way
- 5408 E 111th Dr
- 5347 E 111th Dr
- 11128 Grape Ct
- 5448 E 111th Dr
- 11117 Grape Ct
- 5388 R E 111th Dr
- 11109 Harris Way
- 5388 E 111th Dr
- 11149 Harris Way
- 5327 E 111th Dr
- 5468 E 111th Dr
- 5368 E 111th Dr
- 5501 E 111th Place