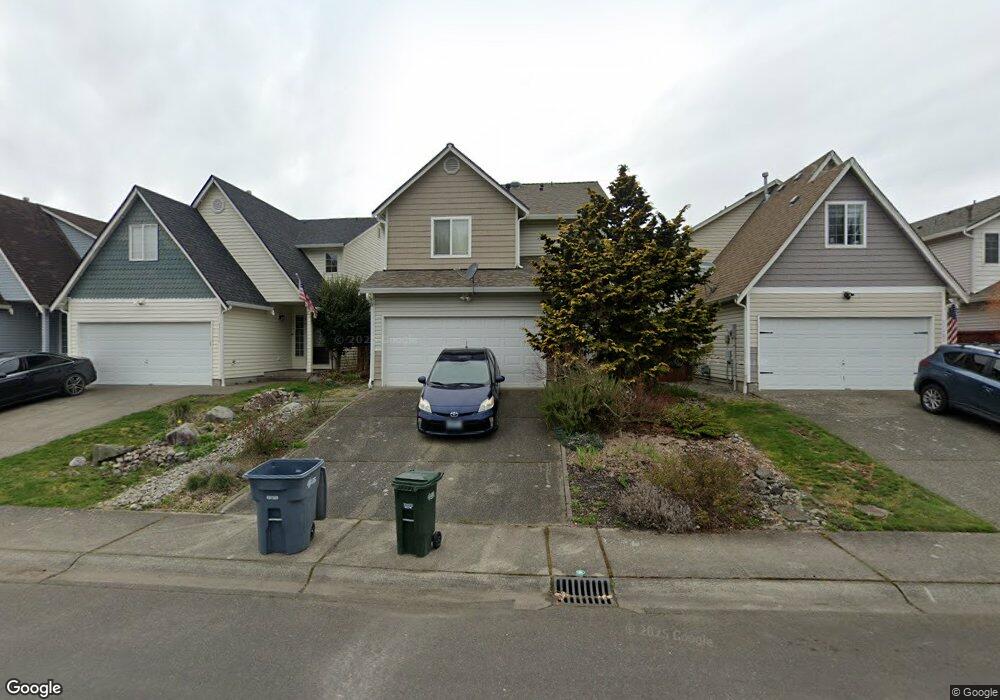
11109 185th Ave E Bonney Lake, WA 98391
Estimated Value: $516,190 - $520,000
3
Beds
3
Baths
1,501
Sq Ft
$345/Sq Ft
Est. Value
About This Home
This home is located at 11109 185th Ave E, Bonney Lake, WA 98391 and is currently estimated at $518,548, approximately $345 per square foot. 11109 185th Ave E is a home located in Pierce County with nearby schools including Bonney Lake Elementary School, Mountain View Middle School, and Bonney Lake High School.
Ownership History
Date
Name
Owned For
Owner Type
Purchase Details
Closed on
Dec 1, 2004
Sold by
Bunday Ronald C
Bought by
Clayton Ann Marie
Current Estimated Value
Home Financials for this Owner
Home Financials are based on the most recent Mortgage that was taken out on this home.
Original Mortgage
$202,094
Outstanding Balance
$100,602
Interest Rate
5.64%
Mortgage Type
FHA
Estimated Equity
$417,946
Purchase Details
Closed on
Sep 17, 2001
Sold by
Riverside Homes Inc
Bought by
Bunday Ronald C and Bunday Donna R
Home Financials for this Owner
Home Financials are based on the most recent Mortgage that was taken out on this home.
Original Mortgage
$164,300
Interest Rate
6.99%
Purchase Details
Closed on
Nov 17, 2000
Sold by
Willowbrook Place Llc
Bought by
Riverside Homes Inc
Home Financials for this Owner
Home Financials are based on the most recent Mortgage that was taken out on this home.
Original Mortgage
$128,800
Interest Rate
7.82%
Create a Home Valuation Report for This Property
The Home Valuation Report is an in-depth analysis detailing your home's value as well as a comparison with similar homes in the area
Home Values in the Area
Average Home Value in this Area
Purchase History
| Date | Buyer | Sale Price | Title Company |
|---|---|---|---|
| Clayton Ann Marie | $204,950 | Trans | |
| Bunday Ronald C | $164,334 | Transnation Title Insurance | |
| Riverside Homes Inc | $45,000 | Chicago Title |
Source: Public Records
Mortgage History
| Date | Status | Borrower | Loan Amount |
|---|---|---|---|
| Open | Clayton Ann Marie | $202,094 | |
| Previous Owner | Bunday Ronald C | $164,300 | |
| Previous Owner | Riverside Homes Inc | $128,800 |
Source: Public Records
Tax History Compared to Growth
Tax History
| Year | Tax Paid | Tax Assessment Tax Assessment Total Assessment is a certain percentage of the fair market value that is determined by local assessors to be the total taxable value of land and additions on the property. | Land | Improvement |
|---|---|---|---|---|
| 2025 | $4,237 | $457,600 | $190,400 | $267,200 |
| 2024 | $4,237 | $440,600 | $190,400 | $250,200 |
| 2023 | $4,237 | $416,400 | $178,900 | $237,500 |
| 2022 | $4,144 | $435,100 | $173,900 | $261,200 |
| 2021 | $3,985 | $305,800 | $114,100 | $191,700 |
| 2019 | $3,354 | $289,100 | $97,900 | $191,200 |
| 2018 | $3,249 | $271,900 | $91,800 | $180,100 |
| 2017 | $2,829 | $231,700 | $69,600 | $162,100 |
| 2016 | $2,461 | $186,900 | $53,400 | $133,500 |
| 2014 | $2,349 | $174,000 | $45,600 | $128,400 |
| 2013 | $2,349 | $160,600 | $40,500 | $120,100 |
Source: Public Records
Map
Nearby Homes
- 11005 184th Ave E
- 18402 109th Street Ct E
- 17926 113th St E
- 10703 185th Ave E
- 18110 114th St E
- 17904 Panorama Blvd E
- 18408 106th St E
- 11601 188th Avenue Ct E
- 18312 104th Street Ct E
- 10908 177th Avenue Ct E
- 10602 177th Avenue Ct E
- 11602 178th Place E
- 17604 Panorama Blvd E
- 10202 184th Ave E
- 17602 110th Street Ct E
- 18306 101st St E
- 10705 176th Ave E
- 19307 115th Street Ct E
- 12115 184th Ave E
- 19316 Rhodes Lake Rd E
- 11107 185th Ave E
- 11111 185th Ave E
- 11105 185th Ave E
- 11113 185th Ave E
- 11103 185th Ave E
- 11115 185th Ave E
- 11108 184th Avenue Place E
- 11104 184th Avenue Place E
- 11112 184th Avenue Place E
- 11117 185th Ave E
- 11101 185th Ave E
- 11102 184th Avenue Place E
- 11112 185th Ave E
- 11110 185th Ave E
- 11114 185th Ave E
- 11114 184th Avenue Place E
- 11108 185th Ave E
- 11116 185th Ave E
- 11106 185th Ave E
- 11002 184th Avenue Place E