11109 Crooked Creek Rd Wake Forest, NC 27587
Estimated Value: $798,000 - $879,728
3
Beds
3
Baths
2,729
Sq Ft
$302/Sq Ft
Est. Value
About This Home
This home is located at 11109 Crooked Creek Rd, Wake Forest, NC 27587 and is currently estimated at $824,932, approximately $302 per square foot. 11109 Crooked Creek Rd is a home located in Wake County with nearby schools including Rolesville Elementary School, Rolesville Middle School, and Rolesville High School.
Ownership History
Date
Name
Owned For
Owner Type
Purchase Details
Closed on
Aug 10, 2018
Sold by
Cooke Stanley T and Cooke Pauline
Bought by
Kimsey Glen
Current Estimated Value
Home Financials for this Owner
Home Financials are based on the most recent Mortgage that was taken out on this home.
Original Mortgage
$380,000
Outstanding Balance
$330,015
Interest Rate
4.5%
Mortgage Type
New Conventional
Estimated Equity
$494,917
Purchase Details
Closed on
Jun 12, 2014
Sold by
Cooke Stanley T
Bought by
Cooke Stanley T and Cooke Pauline
Purchase Details
Closed on
Apr 10, 2000
Sold by
Eddins Mack and Eddins Cleo Perry
Bought by
Cooke Stanley T
Home Financials for this Owner
Home Financials are based on the most recent Mortgage that was taken out on this home.
Original Mortgage
$65,000
Interest Rate
8.34%
Mortgage Type
Seller Take Back
Create a Home Valuation Report for This Property
The Home Valuation Report is an in-depth analysis detailing your home's value as well as a comparison with similar homes in the area
Home Values in the Area
Average Home Value in this Area
Purchase History
| Date | Buyer | Sale Price | Title Company |
|---|---|---|---|
| Kimsey Glen | $475,000 | None Available | |
| Cooke Stanley T | -- | None Available | |
| Cooke Stanley T | $65,000 | -- |
Source: Public Records
Mortgage History
| Date | Status | Borrower | Loan Amount |
|---|---|---|---|
| Open | Kimsey Glen | $380,000 | |
| Previous Owner | Cooke Stanley T | $65,000 |
Source: Public Records
Tax History Compared to Growth
Tax History
| Year | Tax Paid | Tax Assessment Tax Assessment Total Assessment is a certain percentage of the fair market value that is determined by local assessors to be the total taxable value of land and additions on the property. | Land | Improvement |
|---|---|---|---|---|
| 2025 | $4,589 | $714,357 | $202,416 | $511,941 |
| 2024 | $4,456 | $714,357 | $202,416 | $511,941 |
| 2023 | $3,934 | $501,927 | $175,416 | $326,511 |
| 2022 | $3,645 | $501,927 | $175,416 | $326,511 |
| 2021 | $3,547 | $501,927 | $175,416 | $326,511 |
| 2020 | $3,488 | $501,927 | $175,416 | $326,511 |
| 2019 | $4,160 | $506,934 | $273,120 | $233,814 |
| 2018 | $0 | $506,934 | $273,120 | $233,814 |
| 2017 | $3,624 | $506,934 | $273,120 | $233,814 |
| 2016 | $3,551 | $506,934 | $273,120 | $233,814 |
| 2015 | $3,710 | $531,256 | $303,600 | $227,656 |
| 2014 | $3,516 | $531,256 | $303,600 | $227,656 |
Source: Public Records
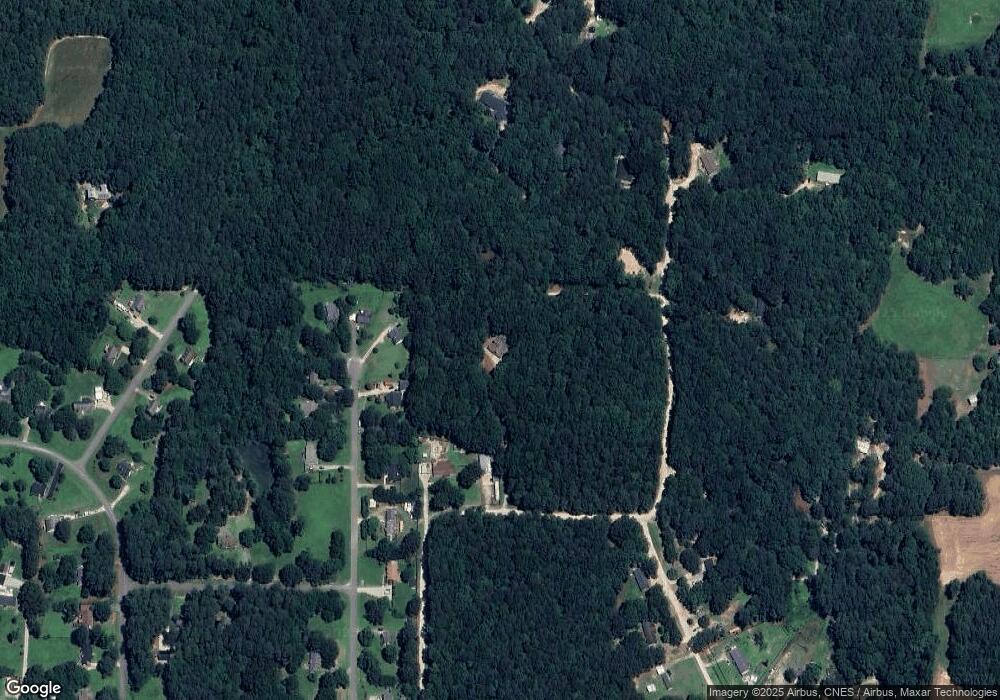
Map
Nearby Homes
- 4225 Burlington Mills Rd
- 11249 Jeffreys Ln
- 4628 Rogers Rd
- 505 Kenton Mill Ct
- 1123 Ambrose Dr
- 1201 Argentum St
- 917 Evening Snow St
- 1035 Evening Shade Ave
- 3037 Freeman Farm Way
- 536 Adkins Ridge Rd
- 1001 Kennison Ct
- 6205 Roles Saddle Dr
- 406 Morgan Brook Way
- 713 Brownwich St
- 1212 Mackinaw Dr
- 309 Leighann Ridge Ln
- 1317 Mackinaw Dr
- 5138 Corner Rock Dr
- 1413 Yardley Dr
- 3004 Freeman Farm Way
- 11217 Crooked Creek Rd
- 5028 Huntmaster Trail
- 5020 Huntmaster Trail
- 5032 Huntmaster Trail
- 5012 Huntmaster Trail
- 5033 Huntmaster Trail
- 5029 Huntmaster Trail
- 11225 Crooked Creek Rd
- 5004 Huntmaster Trail
- 11229 Crooked Creek Rd
- 5025 Huntmaster Trail
- 5017 Huntmaster Trail
- 11221 Crooked Creek Rd
- 11021 Sandaway Ln
- 5000 Huntmaster Trail
- 11228 Crooked Creek Rd
- 4420 Trommel Ct
- 4916 Huntmaster Trail
- 11017 Sandaway Ln
- 4413 Trayer Ln