Estimated Value: $327,471 - $370,000
3
Beds
2
Baths
2,186
Sq Ft
$158/Sq Ft
Est. Value
About This Home
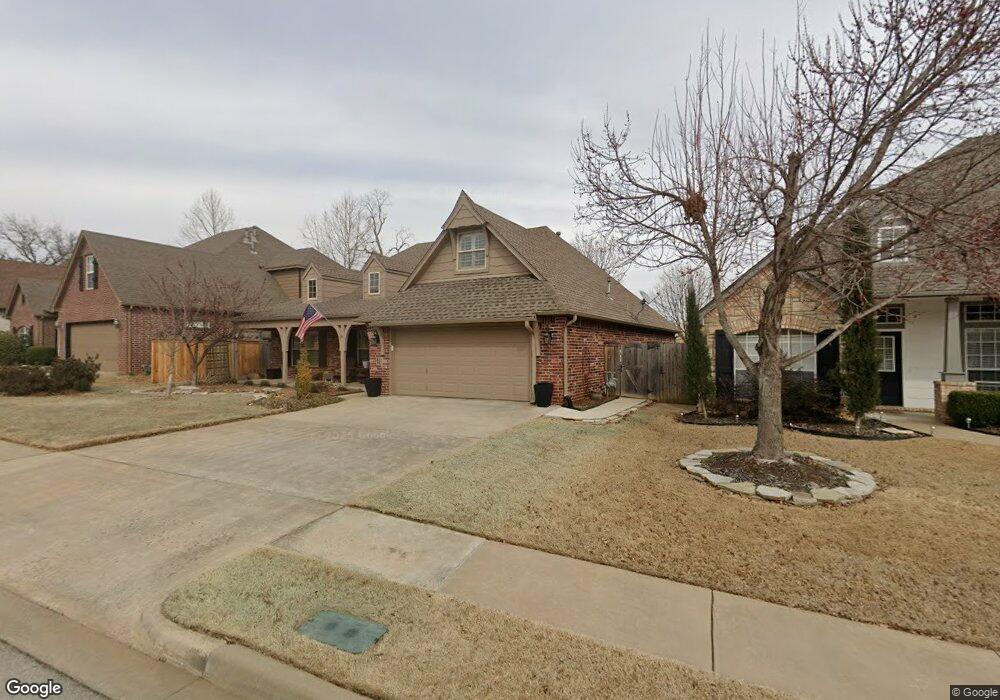
This home is located at 11109 S 3rd St, Jenks, OK 74037 and is currently estimated at $344,368, approximately $157 per square foot. 11109 S 3rd St is a home located in Tulsa County with nearby schools including Jenks West Elementary School, Jenks West Intermediate Elementary School, and Jenks Middle School.
Ownership History
Date
Name
Owned For
Owner Type
Purchase Details
Closed on
Sep 20, 2022
Sold by
Almond Iii Julius H and Almond Lisa T
Bought by
Almond 2022 Trust
Current Estimated Value
Purchase Details
Closed on
May 28, 2008
Sold by
Oonk Michael P and Oonk Paula J
Bought by
Almond Julius H and Almond Lisa G
Home Financials for this Owner
Home Financials are based on the most recent Mortgage that was taken out on this home.
Original Mortgage
$162,000
Interest Rate
5.89%
Mortgage Type
Purchase Money Mortgage
Purchase Details
Closed on
Apr 30, 2004
Sold by
R Cooke Homes Inc
Bought by
Oonk Michael
Home Financials for this Owner
Home Financials are based on the most recent Mortgage that was taken out on this home.
Original Mortgage
$131,900
Interest Rate
5.38%
Mortgage Type
Purchase Money Mortgage
Purchase Details
Closed on
Oct 29, 2003
Sold by
Wallace Properties Inc
Bought by
R Cooke Homes Inc
Create a Home Valuation Report for This Property
The Home Valuation Report is an in-depth analysis detailing your home's value as well as a comparison with similar homes in the area
Home Values in the Area
Average Home Value in this Area
Purchase History
| Date | Buyer | Sale Price | Title Company |
|---|---|---|---|
| Almond 2022 Trust | -- | -- | |
| Almond Julius H | $202,500 | Executives Title & Escrow Co | |
| Oonk Michael | $165,000 | First American Title & Abstr | |
| R Cooke Homes Inc | $35,000 | Tulsa Abstract & Title Co |
Source: Public Records
Mortgage History
| Date | Status | Borrower | Loan Amount |
|---|---|---|---|
| Previous Owner | Almond Julius H | $162,000 | |
| Previous Owner | Oonk Michael | $131,900 | |
| Closed | Oonk Michael | $32,950 |
Source: Public Records
Tax History Compared to Growth
Tax History
| Year | Tax Paid | Tax Assessment Tax Assessment Total Assessment is a certain percentage of the fair market value that is determined by local assessors to be the total taxable value of land and additions on the property. | Land | Improvement |
|---|---|---|---|---|
| 2024 | $2,881 | $23,340 | $2,860 | $20,480 |
| 2023 | $2,881 | $23,631 | $3,131 | $20,500 |
| 2022 | $2,821 | $21,943 | $3,771 | $18,172 |
| 2021 | $2,770 | $21,275 | $3,656 | $17,619 |
| 2020 | $2,709 | $21,275 | $3,656 | $17,619 |
| 2019 | $2,728 | $21,275 | $3,656 | $17,619 |
| 2018 | $2,746 | $21,275 | $3,656 | $17,619 |
| 2017 | $2,701 | $22,275 | $3,828 | $18,447 |
| 2016 | $2,768 | $22,275 | $3,828 | $18,447 |
| 2015 | $2,821 | $22,275 | $3,828 | $18,447 |
| 2014 | $2,884 | $22,275 | $3,828 | $18,447 |
Source: Public Records
Map
Nearby Homes
- 418 E 111th St S
- 11207 S 1st St
- 11304 S 2nd St
- 208 E 113th St S
- 205 E 116th St
- 11427 S Ash St
- 187 E 116th St
- 1734 W 115th Place
- 107 E 116th Place
- 682 W 113th Ct S
- 10625 S Forest Ave
- 11265 S Fir Ave
- 11261 S Fir Ave
- 691 W 113th Ct S
- 11224 S Fir Ave
- 11264 S Fir Ave
- 11312 S Fir Ave
- 11308 S Fir Ave
- 11260 S Fir Ave
- 701 E 119th St S
- 11111 S 3rd St
- 11107 S 3rd St
- 11105 S 3rd St
- 11113 S 3rd St
- 302 E 111th St S
- 4200 111th E
- 11108 S 3rd St
- 11106 S 3rd St
- 303 E 112th St S
- 11115 S 3rd St
- 11110 S 3rd St
- 11103 S 3rd St
- 308 E 111th St S
- 11112 S 3rd St
- 6207 E 111th Place
- 305 E 112th St S
- 223 E 111th Place S
- 219 E 111th Place S
- 309 E 112th St S
- 11109 S 2nd St