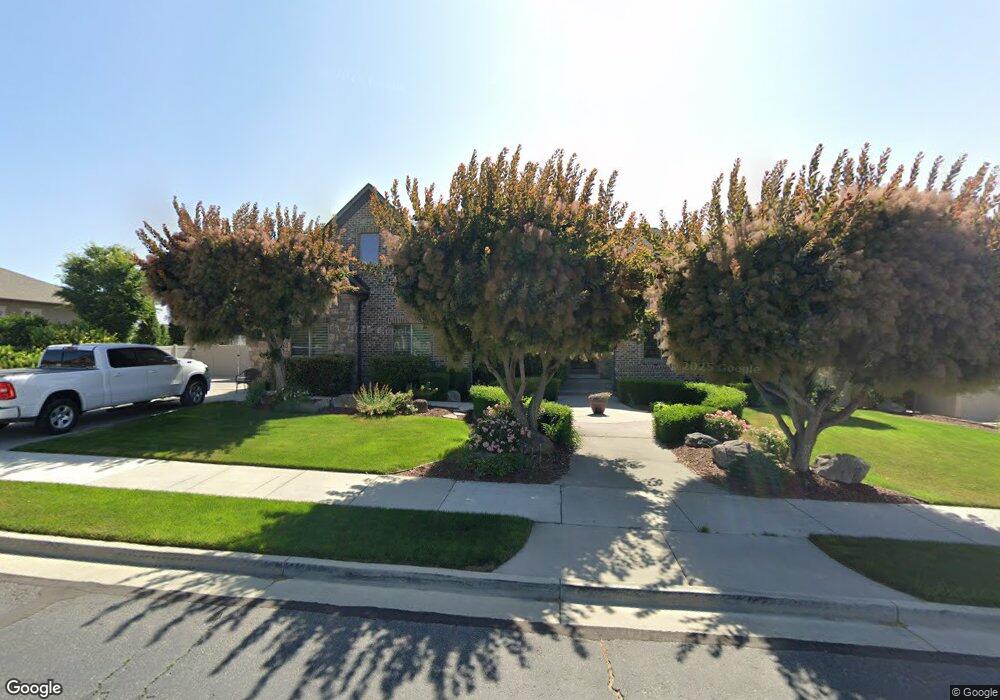
11109 Via Encantada Way South Jordan, UT 84095
Estimated Value: $1,149,000 - $1,376,000
4
Beds
4
Baths
5,229
Sq Ft
$235/Sq Ft
Est. Value
About This Home
This home is located at 11109 Via Encantada Way, South Jordan, UT 84095 and is currently estimated at $1,230,110, approximately $235 per square foot. 11109 Via Encantada Way is a home located in Salt Lake County with nearby schools including Elk Meadows Elementary School, Elk Ridge Middle School, and Mountain West Montessori Academy.
Ownership History
Date
Name
Owned For
Owner Type
Purchase Details
Closed on
Oct 1, 2020
Sold by
Gurr Coby Rick and Gurr Amanda
Bought by
Gurr Coby Rick and Gurr Amanda
Current Estimated Value
Home Financials for this Owner
Home Financials are based on the most recent Mortgage that was taken out on this home.
Original Mortgage
$600,300
Outstanding Balance
$533,935
Interest Rate
2.9%
Mortgage Type
New Conventional
Estimated Equity
$696,175
Purchase Details
Closed on
Mar 4, 2020
Sold by
Gurr Coby and Gurr Amanda
Bought by
Gurr Coby and Gurr Amanda
Home Financials for this Owner
Home Financials are based on the most recent Mortgage that was taken out on this home.
Original Mortgage
$405,000
Interest Rate
3.6%
Mortgage Type
New Conventional
Purchase Details
Closed on
Nov 14, 2017
Sold by
Gurr Coby and Gurr Amanda
Bought by
Gurr Coby and Gurr Amanda
Purchase Details
Closed on
Oct 28, 2015
Sold by
Gurr Coby
Bought by
Gurr Coby and Gurr Amanda
Home Financials for this Owner
Home Financials are based on the most recent Mortgage that was taken out on this home.
Original Mortgage
$434,999
Interest Rate
3.87%
Mortgage Type
VA
Purchase Details
Closed on
Jun 20, 2015
Sold by
Niehus Barrett Alan and Niehus Rebecca Susan Stegeman
Bought by
Gurr Coby
Home Financials for this Owner
Home Financials are based on the most recent Mortgage that was taken out on this home.
Original Mortgage
$560,642
Interest Rate
4.01%
Mortgage Type
VA
Purchase Details
Closed on
Dec 16, 2011
Sold by
Niehus Rebecca Susan Stegeman and Niehus Barrett A
Bought by
Niehus Barrett Alan and Niehus Rebecca Susan Stegeman
Purchase Details
Closed on
Feb 25, 2011
Sold by
Morley Christopher B and Morley Amy W
Bought by
Niehus Rebecca and Niehus Barrett A
Home Financials for this Owner
Home Financials are based on the most recent Mortgage that was taken out on this home.
Original Mortgage
$532,158
Interest Rate
5.5%
Mortgage Type
FHA
Purchase Details
Closed on
Oct 26, 2006
Sold by
Morley Christopher B
Bought by
Morley Christopher B and Morley Amy W
Home Financials for this Owner
Home Financials are based on the most recent Mortgage that was taken out on this home.
Original Mortgage
$190,500
Interest Rate
6.3%
Mortgage Type
Credit Line Revolving
Purchase Details
Closed on
Oct 23, 2006
Sold by
Hj Builders Llc
Bought by
Morley Christopher B
Home Financials for this Owner
Home Financials are based on the most recent Mortgage that was taken out on this home.
Original Mortgage
$190,500
Interest Rate
6.3%
Mortgage Type
Credit Line Revolving
Create a Home Valuation Report for This Property
The Home Valuation Report is an in-depth analysis detailing your home's value as well as a comparison with similar homes in the area
Home Values in the Area
Average Home Value in this Area
Purchase History
| Date | Buyer | Sale Price | Title Company |
|---|---|---|---|
| Gurr Coby Rick | -- | National Ttl Agcy Of Ut Inc | |
| Gurr Coby Rick | -- | National Ttl Agcy Of Ut Inc | |
| Gurr Coby | -- | National Ttl Agcy Of Ut Inc | |
| Gurr Coby | -- | National Ttl Agcy Of Ut Inc | |
| Gurr Coby | -- | None Available | |
| Gurr Coby | -- | Title Guarantee | |
| Gurr Coby | -- | Metro National Title | |
| Niehus Barrett Alan | -- | Metro National Title | |
| Niehus Barrett Alan | -- | None Available | |
| Niehus Rebecca | -- | Metro National Title | |
| Morley Christopher B | -- | Merrill Title | |
| Morley Christopher B | -- | Merrill Title |
Source: Public Records
Mortgage History
| Date | Status | Borrower | Loan Amount |
|---|---|---|---|
| Open | Gurr Coby Rick | $600,300 | |
| Closed | Gurr Coby | $405,000 | |
| Closed | Gurr Coby | $434,999 | |
| Closed | Gurr Coby | $560,642 | |
| Previous Owner | Niehus Rebecca | $532,158 | |
| Previous Owner | Morley Christopher B | $190,500 | |
| Previous Owner | Morley Christopher B | $417,000 | |
| Previous Owner | Morley Christopher B | $410,000 |
Source: Public Records
Tax History Compared to Growth
Tax History
| Year | Tax Paid | Tax Assessment Tax Assessment Total Assessment is a certain percentage of the fair market value that is determined by local assessors to be the total taxable value of land and additions on the property. | Land | Improvement |
|---|---|---|---|---|
| 2025 | $6,013 | $1,221,600 | $275,500 | $946,100 |
| 2024 | $6,013 | $1,141,700 | $262,400 | $879,300 |
| 2023 | $6,002 | $1,075,200 | $254,700 | $820,500 |
| 2022 | $6,180 | $1,085,200 | $249,800 | $835,400 |
| 2021 | $4,901 | $789,500 | $206,500 | $583,000 |
| 2020 | $4,814 | $727,000 | $206,500 | $520,500 |
| 2019 | $4,535 | $673,100 | $195,400 | $477,700 |
| 2018 | $4,257 | $628,700 | $194,300 | $434,400 |
| 2017 | $4,225 | $611,500 | $190,900 | $420,600 |
| 2016 | $4,528 | $621,000 | $176,500 | $444,500 |
| 2015 | $4,148 | $553,200 | $178,200 | $375,000 |
| 2014 | $3,934 | $515,600 | $169,800 | $345,800 |
Source: Public Records
Map
Nearby Homes
- 11159 Via Encantada Way
- 3558 W Via Bello Ct
- 3407 W Pazos Cir Unit 4
- 3312 W Country Bluff Rd
- 11293 S Sweet Pea Ln
- 3732 W Angelica Way
- 3550 W Franco Court #2
- 3749 W Mandrake Way
- 3794 Angelica Way
- 11287 S Winter Bluff Ln
- 10827 S Logan Canyon Rd
- 3537 W Sojo Dr
- 3792 Lilac Heights Dr
- 3028 W Wilkins Peak Ct
- 10988 S Greenvale Ct
- 3577 Haven Hollow Dr
- 11527 S 3600 W
- 3527 Haven Aire Dr
- 10963 S Coastal Dune Dr
- 10716 S Haven Fields Dr
- 11109 S Via Encantada Way
- 11125 Via Encantada Way
- 11089 S Via Encantada Way
- 11112 Via Encantada Way
- 11112 S Via Encantada Way
- 11112 S Via Encantada Way Unit 6
- 11088 S Via Encantada Way
- 11143 Via Encantada Way
- 11126 Via Encantada Way
- 11126 S Via Encantada Way Unit 5
- 11126 S Via Encantada Way
- 11088 Via Encantada Way
- 11138 S Via Encantada Way
- 11138 S Via Encantada Way Unit 4
- 11138 Via Encantada Way
- 3461 W Vista Pradera Way
- 3461 Vista Pradera Way
- 11061 S Via Encantada Way
- 11061 Via Encantada Way
- 11058 Via Encantada Way