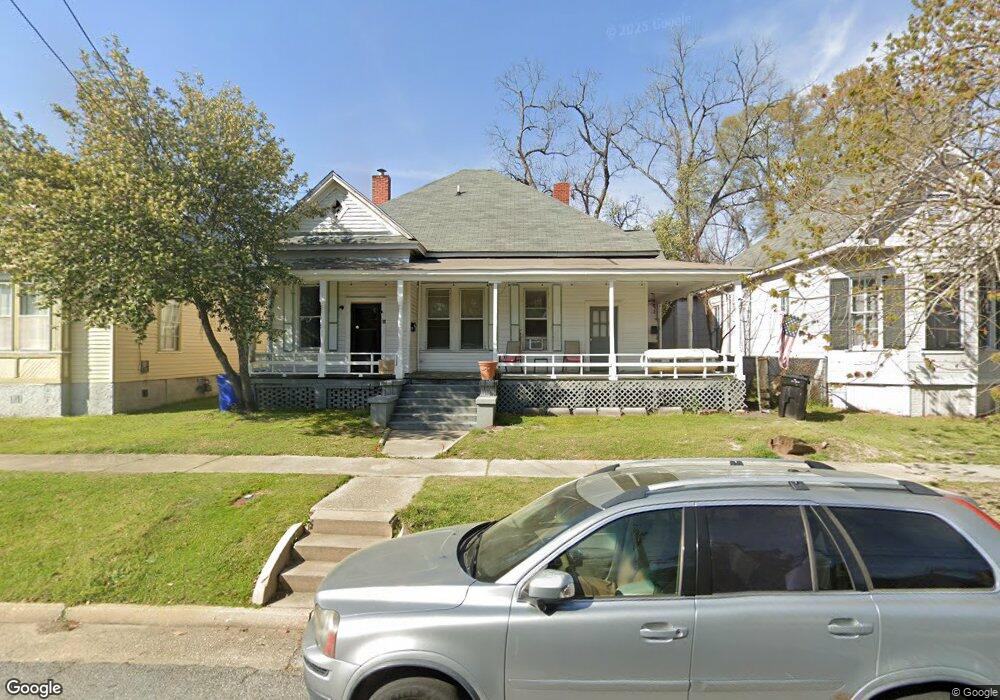
1111 17th St Columbus, GA 31901
East Highlands NeighborhoodEstimated Value: $150,000 - $229,669
5
Beds
4
Baths
2,553
Sq Ft
$70/Sq Ft
Est. Value
About This Home
This home is located at 1111 17th St, Columbus, GA 31901 and is currently estimated at $177,917, approximately $69 per square foot. 1111 17th St is a home located in Muscogee County with nearby schools including Richards Middle School, Jordan Vocational High School, and Wynnton Elementary School.
Ownership History
Date
Name
Owned For
Owner Type
Purchase Details
Closed on
Feb 19, 2026
Sold by
Griffeth Roongsak
Bought by
Funk & Beans Inc
Current Estimated Value
Home Financials for this Owner
Home Financials are based on the most recent Mortgage that was taken out on this home.
Original Mortgage
$121,550
Outstanding Balance
$121,550
Interest Rate
6.16%
Mortgage Type
New Conventional
Estimated Equity
$56,367
Purchase Details
Closed on
Jun 24, 2022
Sold by
Bussey Development Llc
Bought by
Griffeth Roongsak
Create a Home Valuation Report for This Property
The Home Valuation Report is an in-depth analysis detailing your home's value as well as a comparison with similar homes in the area
Home Values in the Area
Average Home Value in this Area
Purchase History
| Date | Buyer | Sale Price | Title Company |
|---|---|---|---|
| Funk & Beans Inc | -- | None Listed On Document | |
| Griffeth Roongsak | $135,000 | None Listed On Document | |
| Bussey Development Llc | -- | None Listed On Document |
Source: Public Records
Mortgage History
| Date | Status | Borrower | Loan Amount |
|---|---|---|---|
| Open | Funk & Beans Inc | $121,550 |
Source: Public Records
Tax History
| Year | Tax Paid | Tax Assessment Tax Assessment Total Assessment is a certain percentage of the fair market value that is determined by local assessors to be the total taxable value of land and additions on the property. | Land | Improvement |
|---|---|---|---|---|
| 2025 | $1,827 | $46,684 | $7,272 | $39,412 |
| 2024 | $1,827 | $46,684 | $7,272 | $39,412 |
| 2023 | $1,694 | $43,012 | $7,272 | $35,740 |
| 2022 | $862 | $21,120 | $4,800 | $16,320 |
| 2021 | $864 | $21,120 | $4,800 | $16,320 |
| 2020 | $1,183 | $34,076 | $7,272 | $26,804 |
| 2019 | $1,396 | $34,076 | $7,272 | $26,804 |
| 2018 | $1,396 | $34,076 | $7,272 | $26,804 |
| 2017 | $1,401 | $34,076 | $7,272 | $26,804 |
| 2016 | $1,143 | $27,703 | $2,607 | $25,096 |
| 2015 | $1,144 | $27,703 | $2,607 | $25,096 |
| 2014 | $1,146 | $27,703 | $2,607 | $25,096 |
| 2013 | -- | $27,703 | $2,607 | $25,096 |
Source: Public Records
Map
Nearby Homes
Your Personal Tour Guide
Ask me questions while you tour the home.