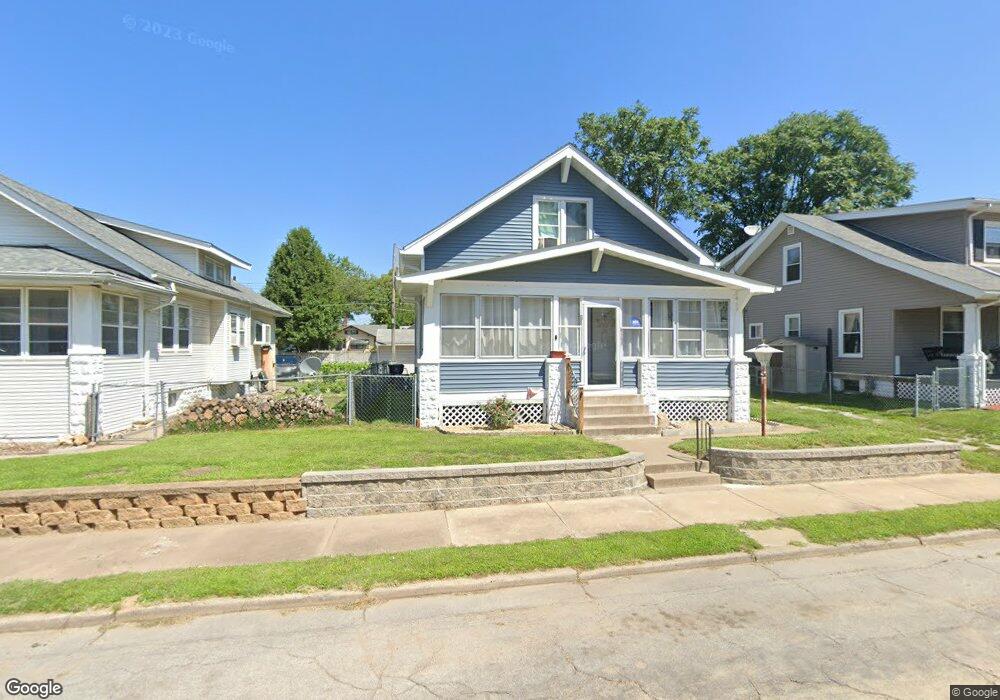
1111 19 1/2 Ave Rock Island, IL 61201
West Central Rock Island NeighborhoodEstimated Value: $71,000 - $92,000
2
Beds
2
Baths
1,509
Sq Ft
$55/Sq Ft
Est. Value
About This Home
This home is located at 1111 19 1/2 Ave, Rock Island, IL 61201 and is currently estimated at $83,197, approximately $55 per square foot. 1111 19 1/2 Ave is a home located in Rock Island County with nearby schools including Frances Willard Elementary School, Edison Jr High School, and Rock Island High School.
Ownership History
Date
Name
Owned For
Owner Type
Purchase Details
Closed on
Jan 11, 2022
Sold by
Pascual Tredo
Bought by
Medina Carolina and Medina Jose G
Current Estimated Value
Purchase Details
Closed on
Nov 24, 2021
Sold by
Trust No 1602313036
Bought by
Trejo Pascual and Trejo Matilde
Purchase Details
Closed on
Jul 14, 2021
Sold by
County Clerk Of County Of Rock Island
Bought by
Trust No 1602313036
Purchase Details
Closed on
Jan 1, 2000
Create a Home Valuation Report for This Property
The Home Valuation Report is an in-depth analysis detailing your home's value as well as a comparison with similar homes in the area
Home Values in the Area
Average Home Value in this Area
Purchase History
| Date | Buyer | Sale Price | Title Company |
|---|---|---|---|
| Medina Carolina | -- | None Listed On Document | |
| Trejo Pascual | -- | Schrimpf Stephen P | |
| Trust No 1602313036 | -- | Schrimpf Stephen P | |
| Trust No 1602313036 | -- | Schrimpf Stephen P | |
| -- | $42,500 | -- |
Source: Public Records
Tax History Compared to Growth
Tax History
| Year | Tax Paid | Tax Assessment Tax Assessment Total Assessment is a certain percentage of the fair market value that is determined by local assessors to be the total taxable value of land and additions on the property. | Land | Improvement |
|---|---|---|---|---|
| 2024 | $1,548 | $21,377 | $4,374 | $17,003 |
| 2023 | $1,548 | $19,558 | $4,002 | $15,556 |
| 2022 | $1,428 | $19,962 | $4,084 | $15,878 |
| 2021 | $1,368 | $18,957 | $3,878 | $15,079 |
| 2020 | $1,322 | $18,440 | $3,772 | $14,668 |
| 2019 | $1,301 | $18,258 | $3,735 | $14,523 |
| 2018 | $1,231 | $17,826 | $3,647 | $14,179 |
| 2017 | $1,804 | $17,234 | $3,526 | $13,708 |
| 2016 | $1,750 | $17,234 | $3,526 | $13,708 |
| 2015 | $1,748 | $17,234 | $3,526 | $13,708 |
| 2014 | -- | $16,537 | $3,383 | $13,154 |
| 2013 | -- | $16,537 | $3,383 | $13,154 |
Source: Public Records
Map
Nearby Homes