Estimated Value: $496,000 - $723,000
4
Beds
4
Baths
3,400
Sq Ft
$187/Sq Ft
Est. Value
About This Home
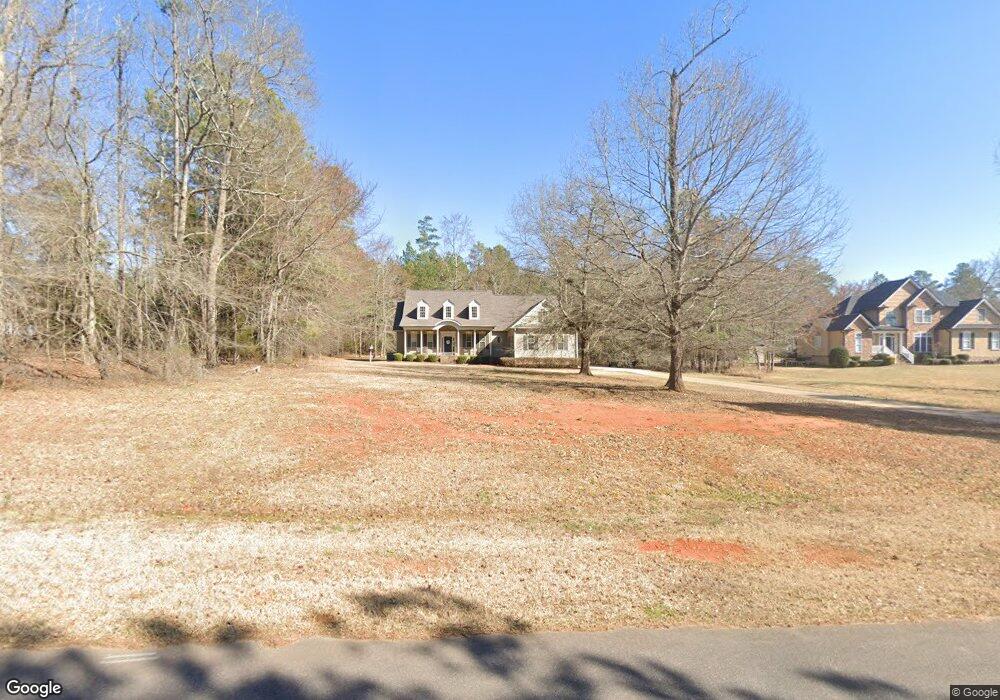
This home is located at 1111 Alysheba Ct, York, SC 29745 and is currently estimated at $634,643, approximately $186 per square foot. 1111 Alysheba Ct is a home located in York County with nearby schools including Hunter Street Elementary School, York Intermediate School, and York Middle School.
Ownership History
Date
Name
Owned For
Owner Type
Purchase Details
Closed on
Mar 1, 2012
Sold by
Estate Of Clarence Dow Waters
Bought by
Waters Rhonda K
Current Estimated Value
Purchase Details
Closed on
Nov 17, 2009
Sold by
Ddbh Llc
Bought by
Waters Clarence D and Waters Rhonda K
Home Financials for this Owner
Home Financials are based on the most recent Mortgage that was taken out on this home.
Original Mortgage
$291,757
Interest Rate
4.98%
Mortgage Type
FHA
Purchase Details
Closed on
Jun 26, 2009
Sold by
Railey Custom Homes Inc
Bought by
Ddbh Llc
Purchase Details
Closed on
Sep 7, 2007
Sold by
Moore Barbara W and Richardson Barbara M
Bought by
Railey Custom Homes Inc
Purchase Details
Closed on
Oct 22, 2003
Sold by
May Green Properties Llc
Bought by
Moore Barbara W
Purchase Details
Closed on
Feb 27, 2001
Sold by
Bradford Charles S and Alexander Porter A
Bought by
Crittendon Joann and Crittendon Charles H
Create a Home Valuation Report for This Property
The Home Valuation Report is an in-depth analysis detailing your home's value as well as a comparison with similar homes in the area
Home Values in the Area
Average Home Value in this Area
Purchase History
| Date | Buyer | Sale Price | Title Company |
|---|---|---|---|
| Waters Rhonda K | -- | -- | |
| Waters Clarence D | $297,140 | -- | |
| Ddbh Llc | $164,000 | -- | |
| Railey Custom Homes Inc | $75,000 | None Available | |
| Moore Barbara W | $44,900 | -- | |
| Crittendon Joann | $24,900 | -- |
Source: Public Records
Mortgage History
| Date | Status | Borrower | Loan Amount |
|---|---|---|---|
| Previous Owner | Waters Clarence D | $291,757 |
Source: Public Records
Tax History Compared to Growth
Tax History
| Year | Tax Paid | Tax Assessment Tax Assessment Total Assessment is a certain percentage of the fair market value that is determined by local assessors to be the total taxable value of land and additions on the property. | Land | Improvement |
|---|---|---|---|---|
| 2024 | $2,157 | $14,720 | $1,818 | $12,902 |
| 2023 | $2,203 | $14,720 | $1,818 | $12,902 |
| 2022 | $2,203 | $14,720 | $1,818 | $12,902 |
| 2021 | -- | $14,720 | $1,818 | $12,902 |
| 2020 | $2,197 | $14,720 | $0 | $0 |
| 2019 | $1,941 | $12,800 | $0 | $0 |
| 2018 | $1,866 | $12,800 | $0 | $0 |
| 2017 | $1,773 | $12,800 | $0 | $0 |
| 2016 | $1,750 | $12,800 | $0 | $0 |
| 2014 | $1,803 | $12,800 | $2,920 | $9,880 |
| 2013 | $1,803 | $13,900 | $2,920 | $10,980 |
Source: Public Records
Map
Nearby Homes
- 3617 Venetian Way
- 1421 Seattle Slew Place
- 8144 Park Place Rd
- 933 Osteen Rd
- 2018 Whiskery Ct
- 438 Bent Burr Creek
- 450 Bent Burr Creek
- 975 Mcafee Ct
- 716 Palmer Pendleton Way
- 712 Palmer Pendleton Way
- 708 Palmer Pendleton Way
- 760 Palmer Pendleton Way
- 814 Santina Ave
- 818 Santina Ave
- 8229 Park Place Rd
- 604 Darya Dr
- 1419 Dove Landing Rd
- 610 Darya Dr
- 806 Santina Ave
- 592 Darya Dr
- 1115 Alysheba Ct
- 1107 Alysheba Ct
- 1119 Alysheba Ct
- 1103 Alysheba Ct
- 3621 Venetian Way
- 1123 Alysheba Ct
- 1118 Alysheba Ct
- 1104 Alysheba Ct
- 1127 Alysheba Ct
- 3635 Venetian Way
- 3635 Venetian Way
- 1130 Alysheba Ct
- 417 Galliant Fox Ct
- 3613 Venetian Way
- 1131 Alysheba Ct
- 409 Gallant Fox Ct
- 3624 Venetian Way
- 1134 Alysheba Ct
- 218 Aristides Dr
- 3639 Venetian Way