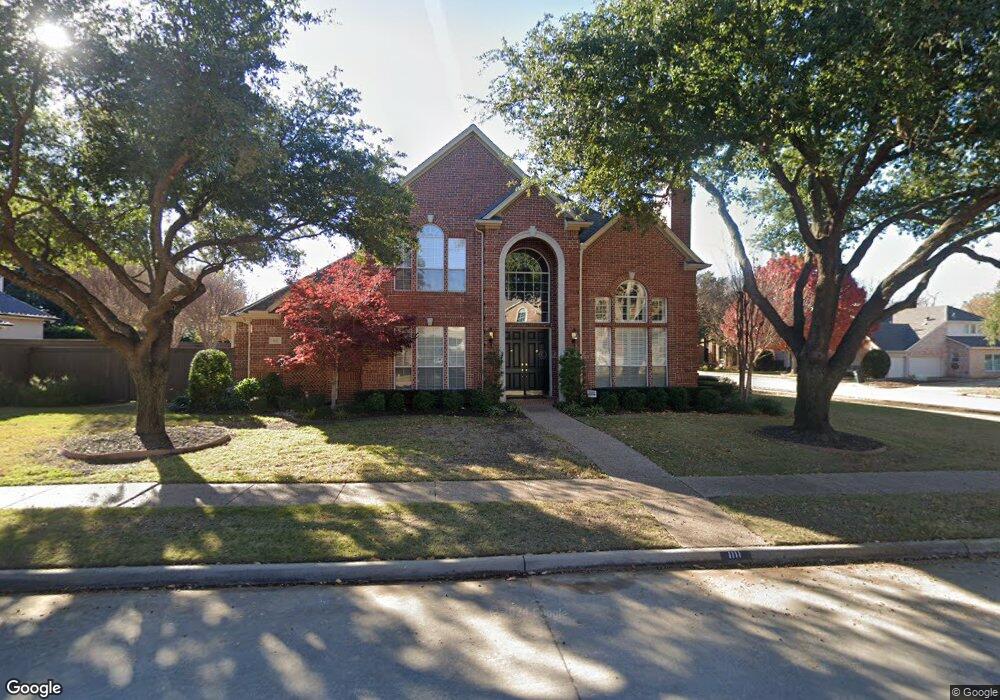
1111 Longford Cir Southlake, TX 76092
Estimated Value: $1,106,000 - $1,239,000
4
Beds
4
Baths
3,738
Sq Ft
$318/Sq Ft
Est. Value
About This Home
This home is located at 1111 Longford Cir, Southlake, TX 76092 and is currently estimated at $1,187,619, approximately $317 per square foot. 1111 Longford Cir is a home located in Tarrant County with nearby schools including Old Union Elementary School, Eubanks Intermediate School, and George Dawson Middle School.
Ownership History
Date
Name
Owned For
Owner Type
Purchase Details
Closed on
Oct 7, 2022
Sold by
Cooke David M
Bought by
Cooke David M
Current Estimated Value
Purchase Details
Closed on
Jan 30, 2002
Sold by
Thackray John and Thackray Ann
Bought by
Cooke David M and Cooke Landy P
Home Financials for this Owner
Home Financials are based on the most recent Mortgage that was taken out on this home.
Original Mortgage
$203,000
Interest Rate
7.15%
Purchase Details
Closed on
Mar 26, 1997
Sold by
Weekley Homes Lp
Bought by
Thackray John S and Thackray Ann M
Home Financials for this Owner
Home Financials are based on the most recent Mortgage that was taken out on this home.
Original Mortgage
$260,150
Interest Rate
5.62%
Create a Home Valuation Report for This Property
The Home Valuation Report is an in-depth analysis detailing your home's value as well as a comparison with similar homes in the area
Home Values in the Area
Average Home Value in this Area
Purchase History
| Date | Buyer | Sale Price | Title Company |
|---|---|---|---|
| Cooke David M | -- | -- | |
| Cooke David M | -- | American Title Co | |
| Thackray John S | -- | -- |
Source: Public Records
Mortgage History
| Date | Status | Borrower | Loan Amount |
|---|---|---|---|
| Previous Owner | Cooke David M | $203,000 | |
| Previous Owner | Thackray John S | $260,150 | |
| Closed | Thackray John S | $32,520 |
Source: Public Records
Tax History Compared to Growth
Tax History
| Year | Tax Paid | Tax Assessment Tax Assessment Total Assessment is a certain percentage of the fair market value that is determined by local assessors to be the total taxable value of land and additions on the property. | Land | Improvement |
|---|---|---|---|---|
| 2025 | $6,247 | $1,124,660 | $175,000 | $949,660 |
| 2024 | $6,247 | $1,124,660 | $175,000 | $949,660 |
| 2023 | $15,795 | $1,077,825 | $175,000 | $902,825 |
| 2022 | $16,996 | $823,587 | $125,000 | $698,587 |
| 2021 | $16,329 | $726,431 | $125,000 | $601,431 |
| 2020 | $14,966 | $651,088 | $125,000 | $526,088 |
| 2019 | $15,825 | $653,526 | $125,000 | $528,526 |
| 2018 | $9,468 | $604,646 | $125,000 | $479,646 |
| 2017 | $14,744 | $604,030 | $125,000 | $479,030 |
| 2016 | $13,404 | $540,765 | $125,000 | $415,765 |
| 2015 | $9,404 | $507,100 | $55,000 | $452,100 |
| 2014 | $9,404 | $507,100 | $55,000 | $452,100 |
Source: Public Records
Map
Nearby Homes
- 1100 La Paloma Ct
- 710 Longford Dr
- 1012 Cool River Dr
- 708 Nettleton Dr
- 712 Ashleigh Ln
- 1401 Chardonnay Ct
- 702 Sussex Ct
- 1227 Strathmore Dr
- 1304 Kings Brook Ct
- 1420 Kensington Ct
- 608 Regency Crossing
- 223 Westwood Dr
- 521 Regency Crossing
- 1032 Rosavine Dr
- 1028 Rosavine Dr
- 1017 Rosavine Dr
- 1004 Rosavine Dr
- 1020 Rosavine Dr
- 1012 Rosavine Dr
- 1024 Rosavine Dr
- 1109 Longford Cir
- 1121 Longford Cir
- 1112 Longford Cir
- 1118 Longford Cir
- 1120 Longford Cir
- 1110 Longford Cir
- 1123 Longford Cir
- 1107 Longford Cir
- 1114 Longford Cir
- 1122 Longford Cir
- 1108 Longford Cir
- 1116 Longford Cir
- 1124 Longford Cir
- 812 Longford Dr
- 1106 Longford Cir
- 1125 Longford Cir
- 1105 Longford Cir
- 810 Longford Dr
- 1126 Longford Cir
- 1104 Longford Cir