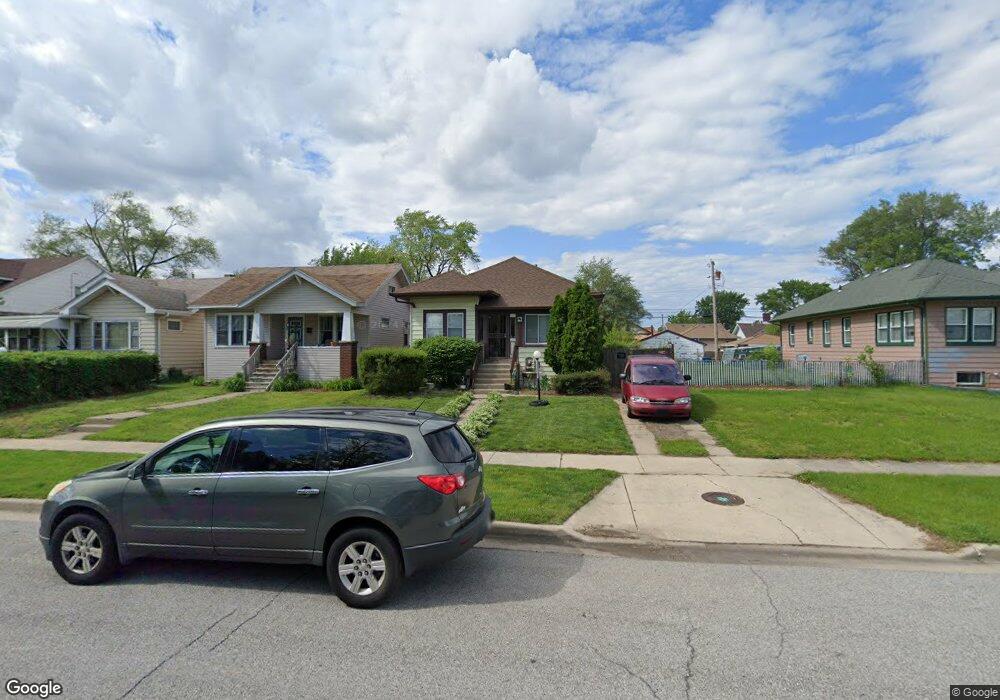
1111 Lyons St Hammond, IN 46320
Estimated Value: $138,000 - $190,000
3
Beds
2
Baths
1,405
Sq Ft
$123/Sq Ft
Est. Value
About This Home
This home is located at 1111 Lyons St, Hammond, IN 46320 and is currently estimated at $172,907, approximately $123 per square foot. 1111 Lyons St is a home located in Lake County with nearby schools including Maywood Elementary School, Eggers Middle School, and Hammond High School.
Ownership History
Date
Name
Owned For
Owner Type
Purchase Details
Closed on
Jun 27, 2025
Sold by
Treadwell Jonas
Bought by
Treadwell Nedra L
Current Estimated Value
Purchase Details
Closed on
Jul 19, 2007
Sold by
Pittman Jennifer
Bought by
Treadwell Jonas
Home Financials for this Owner
Home Financials are based on the most recent Mortgage that was taken out on this home.
Original Mortgage
$82,400
Interest Rate
6.54%
Mortgage Type
Purchase Money Mortgage
Create a Home Valuation Report for This Property
The Home Valuation Report is an in-depth analysis detailing your home's value as well as a comparison with similar homes in the area
Home Values in the Area
Average Home Value in this Area
Purchase History
| Date | Buyer | Sale Price | Title Company |
|---|---|---|---|
| Treadwell Nedra L | -- | None Listed On Document | |
| Treadwell Jonas | -- | Plm Title Company |
Source: Public Records
Mortgage History
| Date | Status | Borrower | Loan Amount |
|---|---|---|---|
| Previous Owner | Treadwell Jonas | $82,400 |
Source: Public Records
Tax History
| Year | Tax Paid | Tax Assessment Tax Assessment Total Assessment is a certain percentage of the fair market value that is determined by local assessors to be the total taxable value of land and additions on the property. | Land | Improvement |
|---|---|---|---|---|
| 2025 | $1,494 | $138,300 | $18,900 | $119,400 |
| 2024 | $5,066 | $123,700 | $18,900 | $104,800 |
| 2023 | $1,298 | $106,000 | $20,900 | $85,100 |
| 2022 | $1,223 | $100,000 | $20,900 | $79,100 |
| 2021 | $778 | $75,600 | $7,000 | $68,600 |
| 2020 | $643 | $67,200 | $7,000 | $60,200 |
| 2019 | $636 | $55,800 | $7,000 | $48,800 |
| 2018 | $552 | $53,600 | $7,000 | $46,600 |
| 2017 | $602 | $52,500 | $7,000 | $45,500 |
| 2016 | $479 | $47,900 | $7,000 | $40,900 |
| 2014 | $425 | $49,300 | $7,000 | $42,300 |
| 2013 | $414 | $49,500 | $7,000 | $42,500 |
Source: Public Records
Map
Nearby Homes