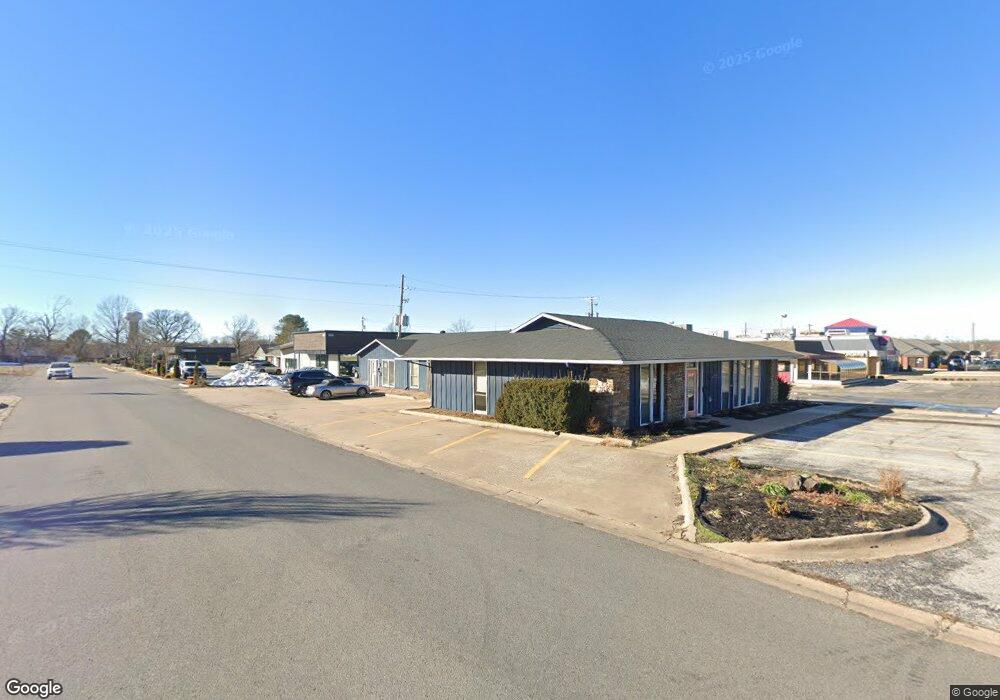
1111 N Walton Blvd Bentonville, AR 72712
Estimated Value: $938,299
--
Bed
--
Bath
3,822
Sq Ft
$245/Sq Ft
Est. Value
About This Home
This home is located at 1111 N Walton Blvd, Bentonville, AR 72712 and is currently estimated at $938,299, approximately $245 per square foot. 1111 N Walton Blvd is a home located in Benton County with nearby schools including Thomas Jefferson Elementary School, Lincoln Junior High School, and Ardis Ann Middle School.
Ownership History
Date
Name
Owned For
Owner Type
Purchase Details
Closed on
Aug 17, 2018
Sold by
Bella Vista Village Property Owners Asso
Bought by
Rlp Investments Llc
Current Estimated Value
Purchase Details
Closed on
Jul 24, 2015
Sold by
Bachman Neal L and Bachman Betty L
Bought by
Rlp Investments Incorporated
Home Financials for this Owner
Home Financials are based on the most recent Mortgage that was taken out on this home.
Original Mortgage
$282,000
Interest Rate
4.06%
Purchase Details
Closed on
Sep 29, 2005
Sold by
Shriver Richard L
Bought by
Shriver Richard L
Purchase Details
Closed on
Aug 2, 2003
Bought by
Dod 08-02-2003
Purchase Details
Closed on
Oct 28, 1988
Bought by
Shriver
Purchase Details
Closed on
Oct 31, 1978
Bought by
Bachman and Bachman Jensen
Purchase Details
Closed on
Jul 14, 1977
Bought by
King
Purchase Details
Closed on
Oct 31, 1973
Bought by
Rees
Create a Home Valuation Report for This Property
The Home Valuation Report is an in-depth analysis detailing your home's value as well as a comparison with similar homes in the area
Home Values in the Area
Average Home Value in this Area
Purchase History
| Date | Buyer | Sale Price | Title Company |
|---|---|---|---|
| Rlp Investments Llc | $1,000 | None Available | |
| Rlp Investments Incorporated | $353,500 | First National Title Company | |
| Shriver Richard L | -- | None Available | |
| Dod 08-02-2003 | -- | -- | |
| Shriver | -- | -- | |
| Bachman | $75,000 | -- | |
| Cooper | -- | -- | |
| King | -- | -- | |
| Rees | $15,000 | -- |
Source: Public Records
Mortgage History
| Date | Status | Borrower | Loan Amount |
|---|---|---|---|
| Previous Owner | Rlp Investments Incorporated | $282,000 |
Source: Public Records
Tax History Compared to Growth
Tax History
| Year | Tax Paid | Tax Assessment Tax Assessment Total Assessment is a certain percentage of the fair market value that is determined by local assessors to be the total taxable value of land and additions on the property. | Land | Improvement |
|---|---|---|---|---|
| 2025 | $7,035 | $138,471 | $47,450 | $91,021 |
| 2024 | $6,478 | $138,471 | $47,450 | $91,021 |
| 2023 | $5,890 | $95,300 | $36,630 | $58,670 |
| 2022 | $5,811 | $95,300 | $36,630 | $58,670 |
| 2021 | $5,309 | $95,300 | $36,630 | $58,670 |
| 2020 | $4,873 | $76,500 | $21,570 | $54,930 |
| 2019 | $4,873 | $76,500 | $21,570 | $54,930 |
| 2018 | $4,873 | $76,500 | $21,570 | $54,930 |
| 2017 | $4,873 | $76,500 | $21,570 | $54,930 |
| 2016 | $4,720 | $76,500 | $21,570 | $54,930 |
| 2015 | $3,238 | $52,400 | $18,630 | $33,770 |
| 2014 | $3,238 | $52,400 | $18,630 | $33,770 |
Source: Public Records
Map
Nearby Homes
- 820 NW 11th St Unit 11
- 9 NW K Place
- 820 NW 11th St
- 816 NW 11th St Unit 12
- 816 NW 11th St
- 809 NW 11th St
- 912 NW 9th St
- 1201 NW 10th St
- 1002 NW 9th St
- 802 NW 13th St
- 1004 Robin Haven Dr
- 809 Carson Dr
- 1402 NW 11th St
- 837 NW 14th St
- 823 NW 14th St
- Lot 8 NW H St
- Lot 7 NW H St
- Lot 7 & 8 NW H St
- 703 NW J St
- 701 NW Ford Ln
- 1101 N Walton Blvd
- 1004 NW 11th St Unit 201
- 1004 NW 11th St Unit 2nd Floor
- 1004 NW 11th St
- 1131 N Walton Blvd Unit A
- 816 NW 11th St
- Lot 2, Block 1 NW 11th St
- 1100 N Walton Blvd
- 1100 N Walton Blvd
- 1100 Walton Blvd
- 1019 N Walton Blvd
- 908 NW 11th St
- 1118 N Walton Blvd
- 1010 NW J St Unit G
- 1010 NW J St Unit H
- 1010 NW J St Unit I
- 1133 N Walton Blvd Unit 3
- 906 NW 11th St
- 1011 N Walton Blvd
- 904 NW 11th St