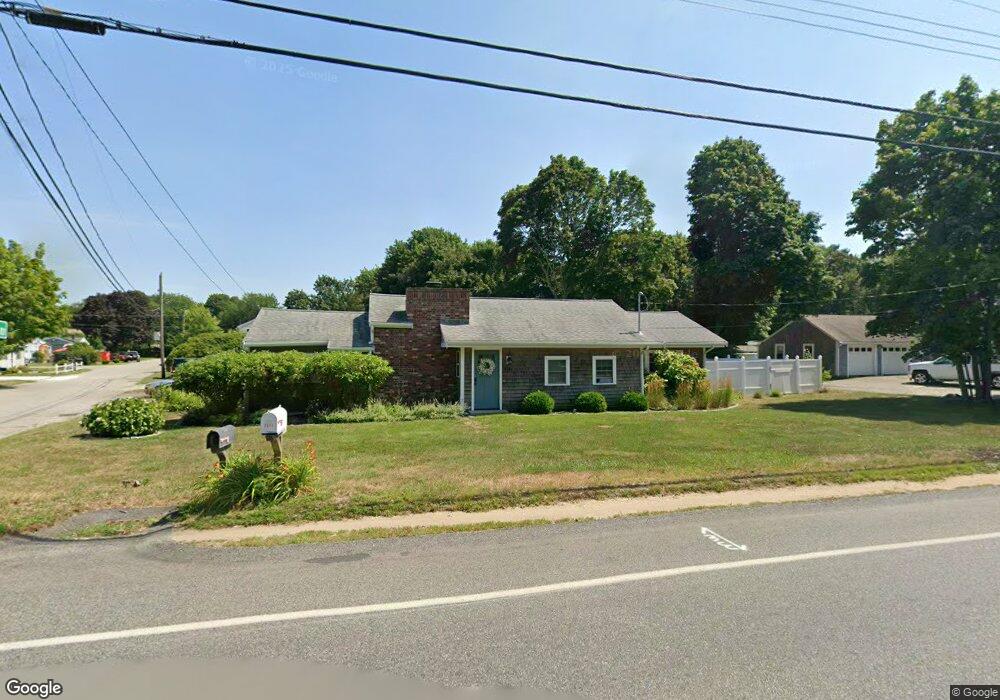
1111 Ocean St Marshfield, MA 02050
Ocean Bluff-Brant Rock NeighborhoodEstimated Value: $575,000 - $705,000
2
Beds
1
Bath
1,498
Sq Ft
$439/Sq Ft
Est. Value
About This Home
This home is located at 1111 Ocean St, Marshfield, MA 02050 and is currently estimated at $658,229, approximately $439 per square foot. 1111 Ocean St is a home located in Plymouth County with nearby schools including Daniel Webster, Furnace Brook Middle School, and Marshfield High School.
Ownership History
Date
Name
Owned For
Owner Type
Purchase Details
Closed on
Apr 27, 2019
Sold by
Schorle Julie E
Bought by
Schorle John M and Schorle Julie E
Current Estimated Value
Home Financials for this Owner
Home Financials are based on the most recent Mortgage that was taken out on this home.
Original Mortgage
$227,000
Outstanding Balance
$197,920
Interest Rate
4%
Mortgage Type
New Conventional
Estimated Equity
$460,309
Purchase Details
Closed on
Aug 26, 2016
Sold by
Us Bank Na Tr
Bought by
Schorle Julie E
Home Financials for this Owner
Home Financials are based on the most recent Mortgage that was taken out on this home.
Original Mortgage
$207,833
Interest Rate
3.42%
Mortgage Type
FHA
Purchase Details
Closed on
May 13, 2015
Sold by
Morrissey Patricia A and Us Bank Na Tr
Bought by
Us Bank Na Tr
Create a Home Valuation Report for This Property
The Home Valuation Report is an in-depth analysis detailing your home's value as well as a comparison with similar homes in the area
Home Values in the Area
Average Home Value in this Area
Purchase History
| Date | Buyer | Sale Price | Title Company |
|---|---|---|---|
| Schorle John M | -- | -- | |
| Schorle John M | -- | -- | |
| Schorle Julie E | $177,949 | -- | |
| Us Bank Na Tr | $253,000 | -- | |
| Us Bank Na Tr | $253,000 | -- |
Source: Public Records
Mortgage History
| Date | Status | Borrower | Loan Amount |
|---|---|---|---|
| Open | Schorle John M | $227,000 | |
| Closed | Schorle John M | $227,000 | |
| Previous Owner | Schorle Julie E | $207,833 |
Source: Public Records
Tax History
| Year | Tax Paid | Tax Assessment Tax Assessment Total Assessment is a certain percentage of the fair market value that is determined by local assessors to be the total taxable value of land and additions on the property. | Land | Improvement |
|---|---|---|---|---|
| 2025 | $5,074 | $512,500 | $295,900 | $216,600 |
| 2024 | $4,951 | $476,500 | $281,800 | $194,700 |
| 2023 | $4,522 | $432,600 | $251,600 | $181,000 |
| 2022 | $4,522 | $349,200 | $197,200 | $152,000 |
| 2021 | $4,436 | $336,300 | $197,200 | $139,100 |
| 2020 | $4,096 | $307,300 | $171,100 | $136,200 |
| 2019 | $3,902 | $291,600 | $171,100 | $120,500 |
| 2018 | $3,841 | $287,300 | $171,100 | $116,200 |
| 2017 | $3,581 | $261,000 | $171,100 | $89,900 |
| 2016 | $3,507 | $252,700 | $165,000 | $87,700 |
| 2015 | $3,272 | $246,200 | $165,000 | $81,200 |
| 2014 | $3,043 | $229,000 | $151,000 | $78,000 |
Source: Public Records
Map
Nearby Homes
- 85 Constitution Rd
- 32 Gratto Rd
- 155 Quincy Ave
- 30 Chandler Dr
- 42 Carr Rd
- 7 Pierce Rd
- 122 June St
- 78 Tower Ave
- 92 Salt Meadow Waye
- 17 Dyke Rd
- 1192 S River St
- 39 High Beacon Way
- 290 S River St
- 16 Schooner Way
- 86 Telegraph Hill Rd
- 106 Careswell St
- 255 Ridge Rd
- 86 Barouche Dr
- 116 Outlook Rd
- 29 Spyglass Landing Dr
Your Personal Tour Guide
Ask me questions while you tour the home.