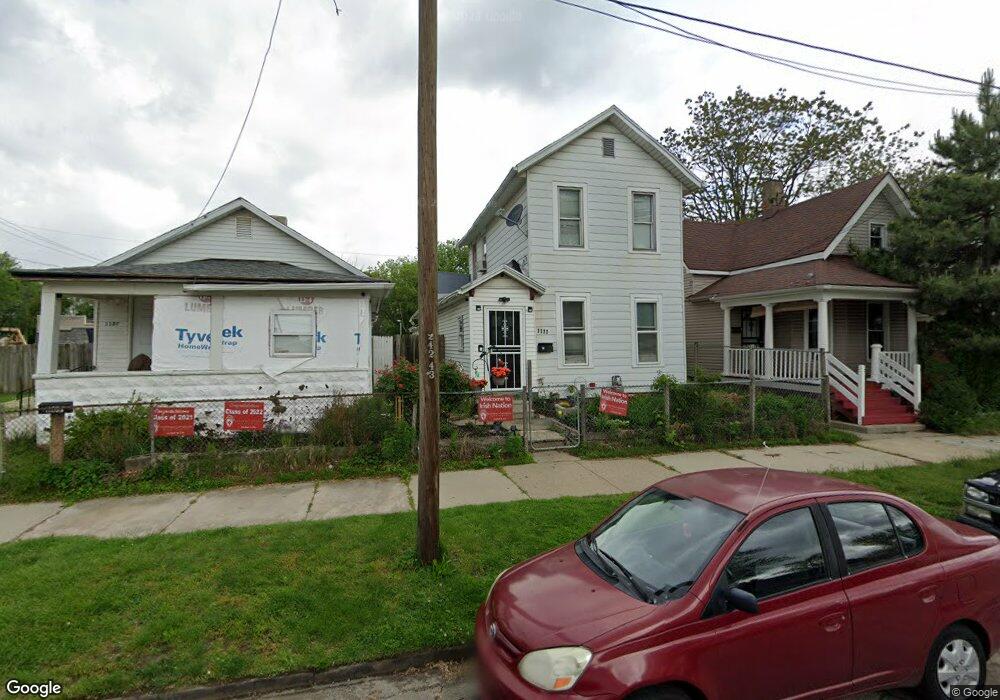
1111 Page St Toledo, OH 43608
Lagrange NeighborhoodEstimated Value: $52,000 - $65,000
3
Beds
2
Baths
1,388
Sq Ft
$40/Sq Ft
Est. Value
About This Home
This home is located at 1111 Page St, Toledo, OH 43608 and is currently estimated at $56,083, approximately $40 per square foot. 1111 Page St is a home located in Lucas County with nearby schools including Sherman Elementary School, Woodward High School, and The Maritime Academy of Toledo.
Ownership History
Date
Name
Owned For
Owner Type
Purchase Details
Closed on
Dec 10, 2010
Sold by
Meza Maricela and Nolasco Gabriela
Bought by
Perez Borjas Ramiro and Mireles Calderon Maria Jesus
Current Estimated Value
Purchase Details
Closed on
May 27, 2009
Sold by
Montalvo Jose
Bought by
Meza Maricela and Nolasco Gabriela
Purchase Details
Closed on
Aug 29, 2002
Sold by
Montalvo Jose and Montalvo Teresa
Bought by
Meza Maricela and Nolasco Gabriela
Home Financials for this Owner
Home Financials are based on the most recent Mortgage that was taken out on this home.
Original Mortgage
$7,000
Interest Rate
15%
Mortgage Type
Seller Take Back
Purchase Details
Closed on
Sep 7, 1994
Sold by
Pryba John C
Bought by
Montalvo Jose and Montalvo Theresa
Create a Home Valuation Report for This Property
The Home Valuation Report is an in-depth analysis detailing your home's value as well as a comparison with similar homes in the area
Home Values in the Area
Average Home Value in this Area
Purchase History
| Date | Buyer | Sale Price | Title Company |
|---|---|---|---|
| Perez Borjas Ramiro | $6,000 | None Available | |
| Meza Maricela | $9,000 | Attorney | |
| Meza Maricela | $9,000 | -- | |
| Montalvo Jose | $4,500 | -- |
Source: Public Records
Mortgage History
| Date | Status | Borrower | Loan Amount |
|---|---|---|---|
| Previous Owner | Meza Maricela | $7,000 |
Source: Public Records
Tax History Compared to Growth
Tax History
| Year | Tax Paid | Tax Assessment Tax Assessment Total Assessment is a certain percentage of the fair market value that is determined by local assessors to be the total taxable value of land and additions on the property. | Land | Improvement |
|---|---|---|---|---|
| 2024 | $354 | $9,100 | $2,135 | $6,965 |
| 2023 | $633 | $8,155 | $1,680 | $6,475 |
| 2022 | $634 | $8,155 | $1,680 | $6,475 |
| 2021 | $638 | $8,155 | $1,680 | $6,475 |
| 2020 | $612 | $6,860 | $1,400 | $5,460 |
| 2019 | $612 | $6,860 | $1,400 | $5,460 |
| 2018 | $601 | $6,860 | $1,400 | $5,460 |
| 2017 | $625 | $6,685 | $1,365 | $5,320 |
| 2016 | $614 | $19,100 | $3,900 | $15,200 |
| 2015 | $604 | $19,100 | $3,900 | $15,200 |
| 2014 | $631 | $6,690 | $1,370 | $5,320 |
| 2013 | $421 | $6,690 | $1,370 | $5,320 |
Source: Public Records
Map
Nearby Homes