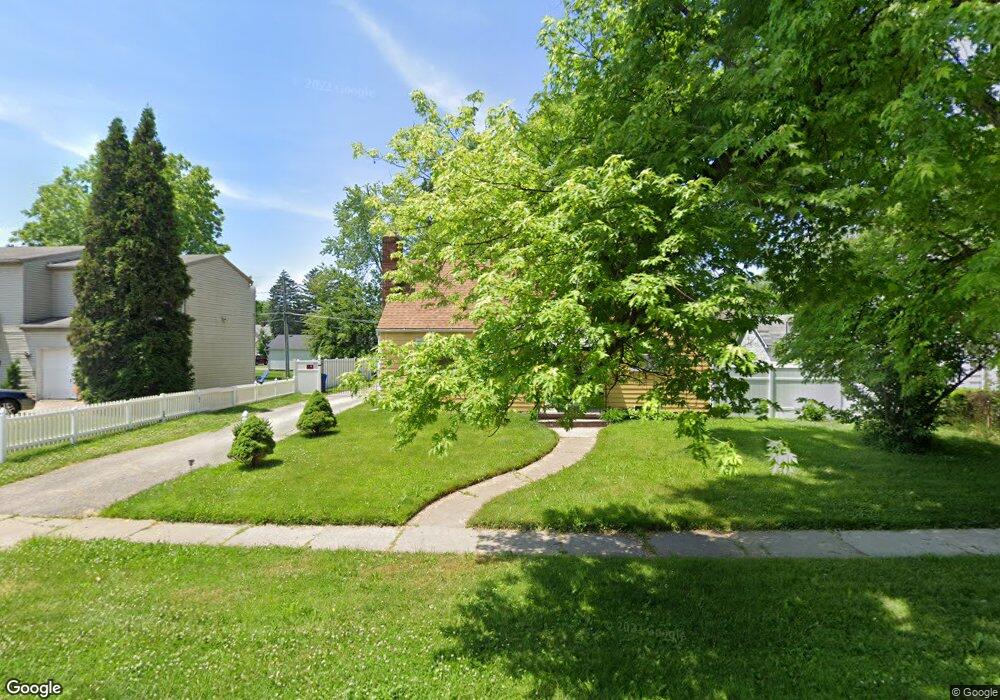
1111 Searles Rd Toledo, OH 43607
Scott Park NeighborhoodEstimated Value: $131,000 - $154,000
3
Beds
3
Baths
1,444
Sq Ft
$97/Sq Ft
Est. Value
About This Home
This home is located at 1111 Searles Rd, Toledo, OH 43607 and is currently estimated at $140,684, approximately $97 per square foot. 1111 Searles Rd is a home located in Lucas County with nearby schools including Keyser Elementary School, Rogers High School, and Victory Academy of Toledo.
Ownership History
Date
Name
Owned For
Owner Type
Purchase Details
Closed on
Sep 3, 2019
Sold by
Mitchell Mary Dortch and Dortch Mary
Bought by
Mitchell Willie C
Current Estimated Value
Purchase Details
Closed on
Dec 28, 2000
Sold by
Ross Larry D
Bought by
Dortch Mary
Home Financials for this Owner
Home Financials are based on the most recent Mortgage that was taken out on this home.
Original Mortgage
$63,000
Interest Rate
7.8%
Purchase Details
Closed on
Nov 8, 2000
Sold by
Short Daren
Bought by
Ross Larry D
Home Financials for this Owner
Home Financials are based on the most recent Mortgage that was taken out on this home.
Original Mortgage
$63,000
Interest Rate
7.8%
Purchase Details
Closed on
May 28, 2000
Sold by
Michael Mayne and Mayne Ray
Bought by
Short Daren
Create a Home Valuation Report for This Property
The Home Valuation Report is an in-depth analysis detailing your home's value as well as a comparison with similar homes in the area
Home Values in the Area
Average Home Value in this Area
Purchase History
| Date | Buyer | Sale Price | Title Company |
|---|---|---|---|
| Mitchell Willie C | -- | None Available | |
| Dortch Mary | $63,000 | -- | |
| Ross Larry D | -- | -- | |
| Ross Larry D | $27,900 | -- | |
| Short Daren | $27,900 | -- |
Source: Public Records
Mortgage History
| Date | Status | Borrower | Loan Amount |
|---|---|---|---|
| Previous Owner | Dortch Mary | $63,000 |
Source: Public Records
Tax History Compared to Growth
Tax History
| Year | Tax Paid | Tax Assessment Tax Assessment Total Assessment is a certain percentage of the fair market value that is determined by local assessors to be the total taxable value of land and additions on the property. | Land | Improvement |
|---|---|---|---|---|
| 2024 | $1,158 | $35,175 | $9,170 | $26,005 |
| 2023 | $2,405 | $35,455 | $7,350 | $28,105 |
| 2022 | $2,379 | $35,455 | $7,350 | $28,105 |
| 2021 | $2,455 | $35,455 | $7,350 | $28,105 |
| 2020 | $2,669 | $34,055 | $7,035 | $27,020 |
| 2019 | $2,581 | $34,055 | $7,035 | $27,020 |
| 2018 | $2,608 | $34,055 | $7,035 | $27,020 |
| 2017 | $2,613 | $33,250 | $6,860 | $26,390 |
| 2016 | $2,621 | $95,000 | $19,600 | $75,400 |
| 2015 | $2,634 | $95,000 | $19,600 | $75,400 |
| 2014 | $2,091 | $33,250 | $6,860 | $26,390 |
| 2013 | $2,091 | $33,250 | $6,860 | $26,390 |
Source: Public Records
Map
Nearby Homes
- 1125 Secor Rd
- 615 Cuthbert Rd
- 1117 Broer Ave
- 826 Ranch Dr
- 914 Turner Ave
- 2013 Bretton Place
- 3205 Kylemore Rd
- 3155 Kylemore Rd
- 735 Southbriar Rd
- 3614 Edgevale Rd
- 3825 Whitegate Dr
- 3305 W Bancroft St
- 539 Independence Rd
- 2221 Meadowwood Dr
- 2235 Meadowwood Dr
- 2666 Montebello Rd
- 1408 Roosevelt Ave
- 2331 Barrington Dr
- 1809 Pilgrim Rd
- 1752 Pilgrim Rd
- 1115 Searles Rd
- 1103 Searles Rd
- 1114 Keil Rd
- 1125 Searles Rd
- 1118 Keil Rd
- 1104 Keil Rd
- 1104 Searles Rd
- 1116 Searles Rd
- 1021 Searles Rd
- 1106 Searles Rd
- 1202 Secor Rd
- 1205 Searles Rd
- 1102 Searles Rd
- 1122 Searles Rd
- 1126 Searles Rd
- 1017 Searles Rd
- 1020 Keil Rd
- 1206 Secor Rd
- 3234 Inverness Ave
- 3231 Downing Ave